
Close menu
- Home
- Topics
- Financial
- Corporate
- Market Analysis
- Retail
- Sustainability
- Technology
- Data Visuals
- More

Infographic - SGI’s Sporting Goods Index outperforms MSCI Index - 2019 update
2020-01-17T21:56:00
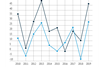
This exclusive chart shows the development of the top 85 stock listed sporting goods companies in comparison with the MSCI Index over the past 10 years (2010 to 2019). This is exclusive data and analysis for Premium Members.
This is premium content
If you are already a premium member of this site, sign in here

Become a premium member today for just €69 a month
As a premium member, you will have access to all the features of your professional account plus:
- 4 additional premium E-mail newsletters
- Data visuals and infographics - downloadable charts, infographics and data
For team or company-wide membership and enquiries see our corporate membership page.

Subscribe
Try SGI Europe for 30 days for just €9,90
- COPYRIGHT © EDM PUBLICATIONS GMBH
- Contact us
- FAQS
- Terms and Conditions
- Privacy & Cookies Policy
- Impressum
- Issues
- Topics A-Z
Find us on social media:
Site powered by Webvision Cloud