
Close menu
- Home
- Topics
- Financial
- Corporate
- Market Analysis
- Retail
- Sustainability
- Technology
- Data Visuals
- More

Global sports industry stock market performers - Q1 2022
2022-04-07T09:07:00
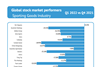
This exclusive interactive chart shows compares the stock performance of the top public companies in the sporting goods industry from Q4 2021 to Q1 2022. The chart can be downloaded. This is exclusive data and analysis for Premium Members.
This is premium content
If you are already a premium member of this site, sign in here
Become a premium member today for just €69 a month
As a premium member, you will have access to all the features of your professional account plus:
- 4 additional premium E-mail newsletters
- Data visuals and infographics - downloadable charts, infographics and data
For team or company-wide membership and enquiries see our corporate membership page.

Subscribe
Try SGI Europe for 30 days for just €9,90
- COPYRIGHT © EDM PUBLICATIONS GMBH
- Contact us
- FAQS
- Terms and Conditions
- Privacy & Cookies Policy
- Impressum
- Issues
- Topics A-Z
Find us on social media:
Site powered by Webvision Cloud