
Sporting goods company inventory levels in Q2 2022
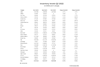
This exclusive interactive chart shows inventory levels at 28 sporting goods companies for Q2 2022, comparing with Q2 2021 and Q4 2021. The chart can be downloaded. This is exclusive data and analysis for Premium Members.

Intelligence, analysis and advice for the global sporting goods industry.
TOPICS
Corporate and FinancialRetail and Supply
Marketing
Consumer
People and HR
Events and Trade Shows
Legal
CSR and Sustainability
Technology and AI
Asia-Pacific
Athlete economy
China and APAC
MARKET ANALYSIS
Analysis and dataIndustry Scorecards
Reports
Case Studies
SERIES and SPECIALS
FIFA World Cup 2026Winter Olympics 2026
Circular Economy
Impact of Sports
Redefining CSR 2025
SUBSCRIPTIONS
Membership plansFAQs
ASK SGIE AI
For premium subscribersABOUT US
About usNewsroom and Contacts
Media solutions
- COPYRIGHT © EDM PUBLICATIONS GMBH
- Contact Us
- FAQS
- Terms and Conditions
- Privacy & Cookies Policy
- Impressum
- Issues
- Topics A-Z