
Market Analysis & Data
Scorecards
Latest Scorecard

Analysis
Q4 2025 Scorecard: Revenue rises, earnings crater
Revenue climbed 8% across 47 companies in Q4 2025, but profits fell by more than a third, as impairments, strategic resets and structural consolidation all pulled in the same direction.
More Scorecards

Q3 2025 Scorecard: Sporting goods winners & losers
SGIE Q3 2025 scorecard: 47 sporting goods companies tracked by sales and profits reveal uneven growth, with smaller firms outpacing larger competitors.

The top sporting goods industry performers by sales and profits in Q2 2025
The 43 publicly traded companies in our quarterly scorecard have experienced a significant 45 percent decline in aggregated profits.

SGI Sporting Goods Scorecard 2024
For those looking for revenue and profit benchmarks of the leading brands and retailers in the sporting goods industry, we bring you our 2024 Sporting Goods Industry Scorecard (Split by Apparel, Footwear, Equipment, and Diversified/Retail)

The top sporting goods industry performers by sales and profits in Q1 2025
Key market players are still in turnaround mode as the sporting goods industry reports its first results of 2025.

Analysis: The top sporting goods industry performers by sales and profits in 2024
Annual profitability increased by 14.6 percent in 2024. Find out more in our latest scorecard.

Analysis: The top sporting goods industry performers by sales and profits in Q4 2024
Seven firms reported one-time charges of at least $10 million, offset by VF Corp., Wolverine Worldwide, Foot Locker, and Zumiez, who were overlapping large end-of-year write-downs. Excluding Topgolf, year-over-year Equipment RoS improved from a 3.8 percent year-on-year decline to essentially flat. Diversified/Retail is Q4’s strongest segment. Year-over-year RoS rose to ...

Analysis: The top sporting goods industry performers by sales and profits in Q3 2024
The aggregate year-over-year sales of 45 publicly traded sporting goods companies declined by less than 1 percent in the reporting period closest to Sept. 30 in Q3 2024. Find out more with our latest scorecard.

Analysis: The top sporting goods industry performers by sales and profit in Q2 2024
One-third of the companies – 15 in all – reported a net loss in the reporting period closest to June 30 in Q2 2024. Find out more with our latest scorecard.

Analysis: The top sporting goods industry performers by sales and profits in Q1 2024
Year-over-year RoS improved for Footwear and Diversified/Retail but declined in both Apparel and Equipment in Q1/24. Find out more in our latest scorecard.
SGI Sporting Goods Scorecard 2023
For those looking for revenue and profit benchmarks of the leading brands and retailers in the sporting goods industry, we bring you our 2023 Sporting Goods Industry Scorecard (Split by Apparel, Footwear, Equipment, and Diversified/Retail)

Analysis: The top sporting goods industry performers by sales and profits in 2023
Annual profitability fell by 10.4 percent in 2023, with a decline in annual revenues of almost 3 percent. Find out more in our latest scorecard.

Analysis: The top sporting goods industry performers by sales and profits in Q4 2023
Quarterly losses were much reduced in Q4, but overall results were still negative. Find out more in our latest scorecard.
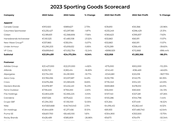
SGI Sporting Goods Scorecard Q3 2023
Find out whose sales are up and whose profits are down for Q3 2023 in our exclusive and downloadable version of our SGI Europe sporting goods industry scorecard. We’ve expanded our coverage and now examine 48 of the leading sporting goods industry companies.

Analysis: The top sporting goods industry performers by sales and profits in Q3 2023
Aggregate net income is down in every sector except one, with two big names shaping overall revenue. Find out more with our latest scorecard.
SGI Sporting Goods Scorecard Q2 2023
How did Apparel, Footwear, Equipment and Retail perform in the second quarter of 2023? Our Sporting Goods Industry Scorecard has the answer.

Analysis: The top sporting goods industry performers by sales and profits in Q2 2023
Facing difficult year-over-year comparisons in many cases, 2/3 of entrants reported lower sales from Q2 2022. Find out more with our scorecard.
SGI Sporting Goods Scorecard Q1 2023
How did Apparel, Footwear, Equipment and Retail perform in the first quarter of 2023? Our Sporting Goods Industry Scorecard has the answer.

The top sporting goods industry performers by sales and profit Q1 2023
Our 2023 Q1 Scorecard includes the revenue and profit development of 48 sporting goods companies, as well as the headlines and analysis
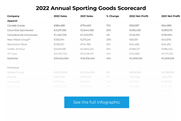
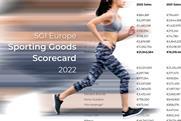
Sporting Goods Scorecard 2022
Our downloadable 2022 Sporting Goods Scorecard brings you the revenue & profit development of 47 global sporting goods companies in numbers
Sporting Goods 2022 – The top companies worldwide by sales and profit
Our updated 2022 Sporting Goods Scorecard brings you the industry winners, with revenue & profit development of 47 sporting goods companies.

Analysis: Sporting Goods Scorecard Q4 2022 – The top performers by sales and profit
Our Q4 Scorecard includes the revenue and profit development of 48 major sporting goods companies.
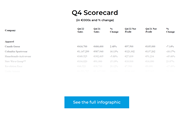
SGI Sporting Goods Scorecard Q4 2022
Find out whose sales are up and whose profits are down in Q4 2022 in our exclusive analysis of the sporting goods industry’s largest players.
Analysis: Sporting Goods Scorecard - Q3 2022
Our Q3 Scorecard includes the revenue and profit development of 41 major sporting goods companies - benchmark yourself with the top players in the industry

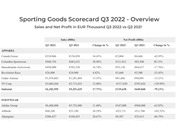
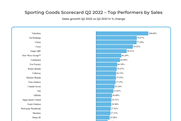
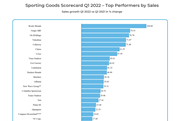
Analysis: Sporting Goods Scorecard Q3 2022 – The top performers by sales and profit
Our Q3 Scorecard includes the revenue and profit development of 42 major sporting goods companies.
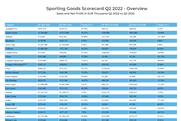
Analysis: Sporting Goods Scorecard Q2 2022 - The top performers by sales and profit
Our Scorecard includes the revenue and profit development of 43 major sporting goods companies.
Sporting Goods Scorecard Q2 2022 - The top performers by sales and profit
This exclusive chart and data can be downloaded by our Premium Members.
Sporting Goods Scorecard Q1 2022 - The top performers by sales and profit
This exclusive chart and data can be downloaded by our Premium Members.
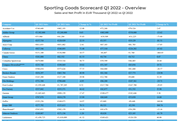
Analysis: Sporting Goods Industry Scorecard Q1 2022
Find out about the top industry performers. With our first quarter 2022 Sporting Goods Industry Scorecard, we provide an overview by sales and profit.
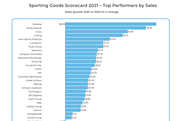
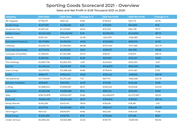
Sporting Goods Scorecard 2021 - The top performers by sales and profit
With our exclusive Sporting Goods Scorecard, we give you an overview of top performers by sales and profit for FY 2021. Find out about the winners and losers in the industry. The Scorecard includes the revenue and profit development of all major global sporting goods brands. The chart can be downloaded. This is exclusive data and analysis for Premium Members.
Sporting Goods Industry Scorecard 2021
Exclusive: We give you an overview of top performers by sales and profit.

Intelligence, analysis and advice for the global sporting goods industry.
TOPICS
Corporate and FinancialRetail and Supply
Marketing
Consumer
People and HR
Events and Trade Shows
Legal
CSR and Sustainability
Technology and AI
Asia-Pacific
Athlete economy
China and APAC
MARKET ANALYSIS
Analysis and dataIndustry Scorecards
Reports
Case Studies
SERIES and SPECIALS
FIFA World Cup 2026Winter Olympics 2026
Circular Economy
Impact of Sports
Redefining CSR 2025
SUBSCRIPTIONS
Membership plansFAQs
ASK SGIE AI
For premium subscribersABOUT US
About usNewsroom and Contacts
Media solutions
- COPYRIGHT © EDM PUBLICATIONS GMBH
- Contact Us
- FAQS
- Terms and Conditions
- Privacy & Cookies Policy
- Impressum
- Issues
- Topics A-Z