
Top sporting goods companies by profit per employee
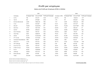
This exclusive interactive chart shows 19 major sporting goods brands as ranked by profit per employee for 2021, with comparative figures for 2020. The chart can be downloaded. This is exclusive data and analysis for Premium Members.
This is Premium content
SIGN-IN if you are already a subscriber of SGI Europe

Become an SGI Europe Premium subscriber
Get access to what the top decision makers are reading in the sporting goods industry:
- Unique international market and benchmarking data about sports brands and retailers
- Exclusive Insights Reports included
- Case Studies on best practices and success cases
- Data visuals and infographics - downloadable charts, infographics and data
- Organisation-wide access across offices, people and devices
View all subscription plans on our subscription page.

Intelligence, analysis and advice for the global sporting goods industry.
TOPICS
Corporate and FinancialRetail and Supply
Marketing
Consumer
People and HR
Events and Trade Shows
Legal
CSR and Sustainability
Technology and AI
Asia-Pacific
Athlete economy
China and APAC
MARKET ANALYSIS
Analysis and dataIndustry Scorecards
Reports
Case Studies
SERIES and SPECIALS
FIFA World Cup 2026Winter Olympics 2026
Circular Economy
Impact of Sports
Redefining CSR 2025
SUBSCRIPTIONS
Membership plansFAQs
ASK SGIE AI
For premium subscribersABOUT US
About usNewsroom and Contacts
Media solutions
- COPYRIGHT © EDM PUBLICATIONS GMBH
- Contact Us
- FAQS
- Terms and Conditions
- Privacy & Cookies Policy
- Impressum
- Issues
- Topics A-Z