
Analysis: The industry’s market cap rose by 9.5% in 2021
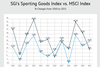
This exclusive chart shows the development in the market capitalization of the top 88 stock-listed sporting goods companies between the end of 2020 and the end of 2021. This is exclusive data and analysis for Professional Members.
This exclusive chart shows the development in the market capitalization of the top 88 stock-listed sporting goods companies between the end of 2020 and the end of 2021. This is exclusive data and analysis for Professional Members.
This is Professional content
Register a free account or login to access 4 more Professional articles
SIGN-IN if you are already a subscriber of SGI Europe.

Become an SGI Europe Professional subscriber
Get access to what the top decision makers are reading in the sporting goods industry:
- Access to all SGI Europe news across 14 coverage areas (Retail, Corporate & M&A, Financial, Product, Marketing, Trade & Sourcing, Sustainability, Technology,…)
- Access exclusive content before it breaks to the public, scoops and breaking news
- Essential E-mail Briefings with the latest analysis and most important industry developments of the international market
- C-Suite Interviews, guest chronicles from industry experts and leaders that are shaping the future of the industry
View all subscription plans on our subscription page.

Intelligence, analysis and advice for the global sporting goods industry.
- COPYRIGHT © EDM PUBLICATIONS GMBH
- Contact us
- FAQS
- Terms and Conditions
- Privacy & Cookies Policy
- Impressum
- Issues
- Topics A-Z