

Consumer Sentiment Infographics
-
 Infographics & Data
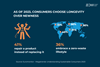
The rise of secondhand shopping and repair in 2023
Consumers in 2023 pivot to secondhand goods and repair services, championing sustainability while navigating economic pressures. This focused insight reveals a growing trend that’s reshaping consumer spending and driving the demand for longevity and environmental responsibility in all products.
-
 Infographics & Data
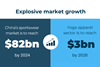
The growth trajectory of China’s athleisure market
China’s athleisure market forecast: Projected to reach $82.8 billion by 2024, highlighting key growth drivers and consumer trends.
-
 Infographics & Data
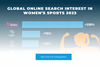
Women’s sports lead online search 2023
Which women’s sports have soared in search? What athletes have captivated the digital world? Discover the worldwide popularity of women’s sports in online searches in 2024.
-
 Infographics & Data
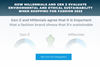
2023 consumer trends: Demand for sustainability among Gen Z and Millennial fashion shoppers
See how 2023’s fashion choices are being reshaped by Gen Z and Millennials’ unique sustainability values.
-
 Infographics & Data
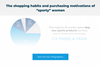
The purchasing habits and motivations of “sporty” women
A new study has revealed the sports product shopping habits of women who regularly take part in sports. The results give an insight into what sports products women buy, how often, and what motivates their purchases.
-
 Infographics & Data
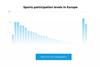
Sports participation levels in Europe
Nearly half of the EU practiced some form of physical activity at least once a week, but there is a big difference across the countries.
-
 Infographics & Data
Becoming a super-winner in the sporting goods industry: The numbers from McKinsey
Some of the key numbers and strategies from McKinsey’s webinar “Becoming a super winner in the sporting goods industry,” available now only at SGI Europe.
-
 Infographics & Data
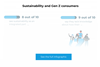
Sustainability and Gen Z Consumers
We bring you some key numbers from the latest research into Gen Z consumers and their thoughts on sustainability. See what 9 out of 10 think.
-
 Infographics & Data
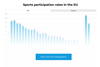
Sports participation rates in the EU by gender
Around 44 percent of the EU population do physical activity at least once a week. We take a closer look at the figures for each country.
-
 Infographics & Data
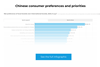
Chinese consumer preferences
McKinsey sees a Chinese market with “robust underlying demand.” But what leads to consumers’ preference for local over international brands?
-
 Infographics & Data
Running motivations: new pandemic vs pre-pandemic runners
Source: RunRepeat The report is available online.
-
 Infographics & Data
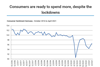
Consumer Sentiment Germany
This infographic shows the consumer sentiment development in Germany until April 2021 - surveyed by the HDE (Handelsverband Deutschland)

