

All Infographics & Data articles
View all stories of the same content type.
-
 Infographics & Data
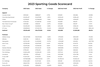
SGI Sporting Goods Scorecard 2024
For those looking for revenue and profit benchmarks of the leading brands and retailers in the sporting goods industry, we bring you our 2024 Sporting Goods Industry Scorecard (Split by Apparel, Footwear, Equipment, and Diversified/Retail)
-
 Infographics & Data
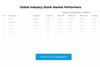
Full list: Global sporting goods industry stock market performers 2024
How did the sporting goods industry do in 2024? Download our list of the 85 stock-listed sporting goods companies and their results from last year.
-
 Infographics & Data
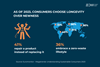
The rise of secondhand shopping and repair in 2023
Consumers in 2023 pivot to secondhand goods and repair services, championing sustainability while navigating economic pressures. This focused insight reveals a growing trend that’s reshaping consumer spending and driving the demand for longevity and environmental responsibility in all products.
-
 Infographics & Data
Decathlon’s status and evolution in 2024
Decathlon, the world’s largest sports retailer and the third most popular sports brand globally, has undergone a remarkable evolution. With a bold rebrand, strategic digital innovations, and key partnerships in global sports events, the company is redefining its place in the sports industry and shaping the future of retail.
-
 Infographics & Data
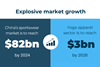
The growth trajectory of China’s athleisure market
China’s athleisure market forecast: Projected to reach $82.8 billion by 2024, highlighting key growth drivers and consumer trends.
-
 Infographics & Data
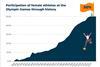
From zero to fifty: Achieving gender parity in Olympic Movement
Discover the journey towards gender equality in the Olympic Movement with our detailed infographic, showcasing key milestones and the remarkable increase in female athlete participation from 0% in 1896 to a projected 50% in 2024.
-
 Infographics & Data
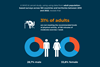
Physical inactivity among adolescents and adults
The latest data from the World Health Organization (WHO) highlights a significant global challenge: adolescents and adults are not meeting recommended physical activity levels.
-
 Infographics & Data
SGI Sporting Goods Scorecard 2023
For those looking for revenue and profit benchmarks of the leading brands and retailers in the sporting goods industry, we bring you our 2023 Sporting Goods Industry Scorecard (Split by Apparel, Footwear, Equipment, and Diversified/Retail)
-
 Infographics & Data
Analysis: China’s booming athleisure market
China’s athleisure market is booming. By 2024, its set to surge to $82.2 billion, according to insights from Retail in Asia.
-
 Infographics & Data
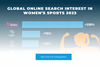
Women’s sports lead online search 2023
Which women’s sports have soared in search? What athletes have captivated the digital world? Discover the worldwide popularity of women’s sports in online searches in 2024.
-
 Infographics & Data
2023 consumer trends: Demand for sustainability among Gen Z and Millennial fashion shoppers
See how 2023’s fashion choices are being reshaped by Gen Z and Millennials’ unique sustainability values.
-
 Infographics & Data
Full list: Global sporting goods industry stock market performers 2023
How did the sporting goods industry do in 2023? Download our list of the 86 stock-listed sporting goods companies and their results from last year.
-
 Infographics & Data
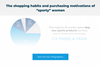
The purchasing habits and motivations of “sporty” women
A new study has revealed the sports product shopping habits of women who regularly take part in sports. The results give an insight into what sports products women buy, how often, and what motivates their purchases.
-
 Infographics & Data
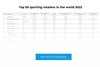
Top 50 sporting retailers in the world 2022
Download our annual overview of the world’s 50 largest sports retailers, including revenue and growth ranking compared with last year.
-
 Infographics & Data
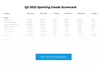
SGI Sporting Goods Scorecard Q3 2023
Find out whose sales are up and whose profits are down for Q3 2023 in our exclusive and downloadable version of our SGI Europe sporting goods industry scorecard. We’ve expanded our coverage and now examine 48 of the leading sporting goods industry companies.
-
 Infographics & Data
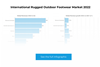
Outdoor footwear market 2022
2022 outdoor footwear sales are up. 5 companies represented just over 50% of all sales. We have all the growth, market share and sales numbers.
-
 Infographics & Data
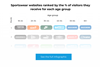
Sportswear websites ranked by visitor age group
Which UK sportswear retailer website gets the most visits from Gen Z? What about Millennials? And which is the most popular sportswear retailer website for those over 65? Our infographic shows how online shopping tastes change with age.
-
 Infographics & Data
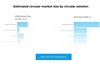
Estimated 2026 circular market size by circular solution
According to a McKinsey analysis, the European sports circular market is expected to grow 20–25 percent a year, reaching €30–50 billion by 2030. But which sectors offer the most immediate potential for growth? Resale? Repair? Recycling? Or something else?
-
 Infographics & Data
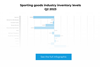
Sporting goods industry inventory levels Q2 2023
In our newly expanded list, now covering inventory levels at 27 leading sporting goods companies, we bring you a downloadable list of inventory levels for the period ending closest to June 30, 2023.
-
 Infographics & Data
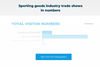
Sporting goods industry trade shows in numbers
With ISPO Munich just weeks away, we take a look at the numbers behind some of the sporting goods industry’s key trade shows.

