

All Infographics & Data articles – Page 3
-
 Infographics & Data
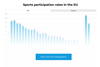
Sports participation rates in the EU by gender
Around 44 percent of the EU population do physical activity at least once a week. We take a closer look at the figures for each country.
-
 Infographics & Data
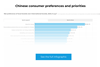
Chinese consumer preferences
McKinsey sees a Chinese market with “robust underlying demand.” But what leads to consumers’ preference for local over international brands?
-
 Infographics & Data
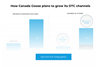
Canada Goose’s DTC growth plan
Canada Goose’s 5-year goals announced in February aim to increase DTC penetration. We look at a breakdown of the luxury brand’s own figures.
-
 Infographics & Data
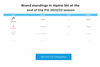
Brand standings at the end of the FIS 2022/23 season
To mark the end of the ski season, we’re sharing the brand standings of the FIS Alpine 2022/23 competition and discuss why brands sponsor winter sports.
-
 Infographics & Data
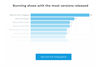
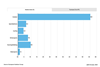
Running shoes with the most versions released
Marathon season is on its way, and runners everywhere are lacing up their favorites. But which trainer models have stood the test of time?
-
 Infographics & Data
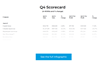
SGI Sporting Goods Scorecard Q4 2022
Find out whose sales are up and whose profits are down in Q4 2022 in our exclusive analysis of the sporting goods industry’s largest players.
-
 Infographics & Data
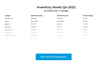
Sporting goods company inventory levels in Q4 2022
We’ve compiled inventory levels at the top sporting goods companies in Q4 2022. Found out how they compare with 2021 and across the industry
-
 Infographics & Data
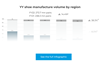
Yue Yuen’s 2022 shoe manufacture volume by region
We bring you a breakdown of Yue Yuen’s shoe manufacture volume by region
-
 Infographics & Data
European 2022 retail sell-out sales across outdoor segments
We bring you a breakdown of retail sell-out sales across six outdoor segments in 2022 across six European countries
-
 Infographics & Data
Gender and leadership in the sporting goods industry
How many women are on the executive teams and boards in the sporting goods industry? Find out in our latest exclusive interactive graphic.
-
 Infographics & Data
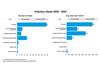
Sporting goods deals 2016-2021
What was the average deal size and which category had the most deals 2016-2021? Find out in our latest interactive graphic.
-
 Infographics & Data
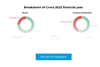
Crocs 2022 financial year revenue in detail
See how Crocs’ revenue for 2022 breaks down in our latest graphic.
-
 Infographics & Data
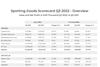
Analysis: Sporting Goods Scorecard - Q3 2022
Our Q3 Scorecard includes the revenue and profit development of 41 major sporting goods companies - benchmark yourself with the top players in the industry
-
 Infographics & Data
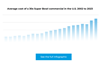
Average cost of a 30 second Super Bowl commercial in the U.S. 2002 to 2023
Found out how dramatically the cost of advertising at the Super Bowl has increased in our latest graphic.
-
 Infographics & Data
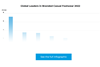
Global leaders in branded casual footwear 2022
Found out who were the leading casual footwear brands in 2022 in our latest graphic.
-
 Infographics & Data
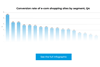
Conversion rate of e-com shopping sites by segment, Q4
See the conversion rates of various e-com segments in Q4, including four sporting apparel and footwear categories, in our graphic.
-
 Infographics & Data
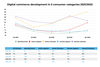
Digital commerce development in 5 consumer categories 2021/2022
See the changes in digital commerce revenue of the last 12 months in sporting goods, footwear, apparel and more in our graphic.
-
 Infographics & Data
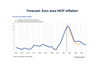
Forecasted HICP inflation in the Euro area
This chart shows the forecasted inflation rates for 2023 and 2024 in the Euro Zone from Eurosystem (the central banking system of the EU)
-
 Infographics & Data
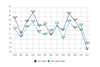
SGI’s Sporting Goods Index vs MSCI Index – 2022 Update
This exclusive chart shows the development of the top 87 stock-listed sporting goods companies compared to the MSCI Index over the past 12 years (2010 to 2022).
-
 Infographics & Data
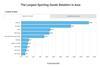
The largest sporting goods retailers in Asia
Our exclusive annual analysis of the largest sporting goods retailers in Asia. Charts and data are downloadable. Exclusive for Premium Members.

