

All Infographics articles
-
 Infographics & Data
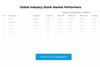
Full list: Global sporting goods industry stock market performers 2024
How did the sporting goods industry do in 2024? Download our list of the 85 stock-listed sporting goods companies and their results from last year.
-
 Infographics & Data
Full list: Global sporting goods industry stock market performers 2023
How did the sporting goods industry do in 2023? Download our list of the 86 stock-listed sporting goods companies and their results from last year.
-
 Infographics & Data
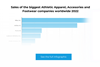
Sales of the biggest Athletic Apparel, Accesories and Footwear companies worldwide 2022
This week’s infographic comes from Statista, who compiled the Athletic Apparel, Accessories and Footwear sales figures for some of the biggest sporting goods companies worldwide, Jan. 2022 – Jan. 2023.
-
 Infographics & Data
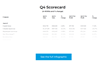
SGI Sporting Goods Scorecard Q4 2022
Find out whose sales are up and whose profits are down in Q4 2022 in our exclusive analysis of the sporting goods industry’s largest players.
-
 Infographics & Data
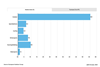
European 2022 retail sell-out sales across outdoor segments
We bring you a breakdown of retail sell-out sales across six outdoor segments in 2022 across six European countries
-
 Infographics & Data
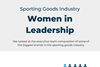
Gender and leadership in the sporting goods industry
How many women are on the executive teams and boards in the sporting goods industry? Find out in our latest exclusive interactive graphic.
-
 Infographics & Data
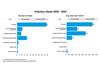
Sporting goods deals 2016-2021
What was the average deal size and which category had the most deals 2016-2021? Find out in our latest interactive graphic.
-
 Infographics & Data
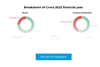
Crocs 2022 financial year revenue in detail
See how Crocs’ revenue for 2022 breaks down in our latest graphic.
-
 Infographics & Data
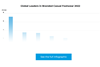
Global leaders in branded casual footwear 2022
Found out who were the leading casual footwear brands in 2022 in our latest graphic.
-
 Infographics & Data
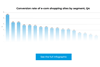
Conversion rate of e-com shopping sites by segment, Q4
See the conversion rates of various e-com segments in Q4, including four sporting apparel and footwear categories, in our graphic.
-
 Infographics & Data
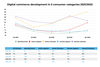
Digital commerce development in 5 consumer categories 2021/2022
See the changes in digital commerce revenue of the last 12 months in sporting goods, footwear, apparel and more in our graphic.
-
 Infographics & Data
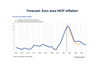
Forecasted HICP inflation in the Euro area
This chart shows the forecasted inflation rates for 2023 and 2024 in the Euro Zone from Eurosystem (the central banking system of the EU)

