

All Data Visuals articles – Page 6
-
 Infographics & Data
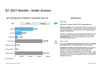
Earnings - Q1 2021 Results Under Armour
This earnings briefing includes the highlights of the earnings results of Q1 2021 from Under Armour
-
 Infographics & Data
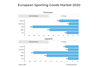
European Sports Sporting Goods Market 2020
The market for sports clothing and footwear fell by 8 percent to €28.3 billion in the five major European countries in 2020, according to revised estimates from NPD Group.
-
 Infographics & Data
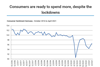
Consumer Sentiment Germany
This infographic shows the consumer sentiment development in Germany until April 2021 - surveyed by the HDE (Handelsverband Deutschland)
-
 Infographics & Data
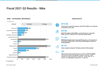
Earnings - Fiscal 2021 Q3 Results - Nike
This earnings briefing includes the highlights of the fiscal 2021 financial results (Q3 ending 28.02.2021) from Nike.
-
 Infographics & Data
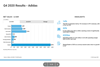
Earnings - Q4 2020 and FY 2020 Results Adidas
This earnings briefing includes the highlights of the Q4 results and FY 2020 from Adidas.
-
 Infographics & Data
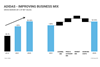
Infographic Adidas - Improving Business Mix
This infographic shows gross margin improvement from Adidas from 48,3% in 2015 to expected ~52% in 2021. It also shows how Adidas is planning to increase the gross margin further to 53% to 55% by 2025.
-
 Infographics & Data
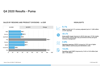
Earnings - Q4 2020 and FY 2020 Results Puma
This earnings briefing includes the highlights of the Q4 results and FY 2020 from Puma
-
 Infographics & Data
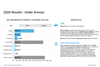
Earnings - 2020 Results Under Armour
This earnings briefing includes the highlights of the report results of 2020 and the Outlook 2021 from Under Armour
-
 Infographics & Data
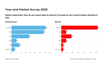
Infographic - 2021 Sales Outlook for the European Outdoor industry
This infographic includes the results of a recent study conducted by the European Outdoor Group. It shows the expected sales development (at retail and wholesale level) in Europe in 2021 from the surveyed Outdoor Brands.
-
 Infographics & Data
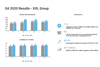
Earnings - Q4 2020 Results XXL Group
This earnings briefing includes the highlights of the Q4 2020 Interim Report of XXL Group
-
 Infographics & Data
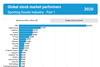
Ranking - Global stock market performers 2020
This exclusive chart shows the ranking of the largest listed sporting goods companies in 2020 by market capitalization. The chart can be downloaded in JPG, PNG or PDF format. This is exclusive data for Premium Members.
-
 Infographics & Data
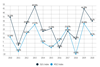
Infographic - SGI’s Sporting Goods Index outperforms MSCI Index - 2020 Update
This exclusive chart shows the development of the top 86 stock listed sporting goods companies in comparison with the MSCI Index over the past 10 years (2010 to 2020).
-
 Infographics & Data
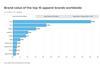
Brand value of the top 10 apparel brands worldwide in 2020
This infographic shows the brand value 2020 vs 2019 of the leading international apparel brands (source: BrandZ, Kantar). This chart can be downloaded as JPG, PNG or PDF.
-
 Infographics & Data
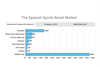
The Spanish Sports Retail Market
This interactive chart shows the largest spanish sports retailers by revenue, total market size 2019, market shares and revenue development vs the previous year. This chart can be downloaded as JPG, PNG or PDF.
-
 Infographics & Data
The German Sports Retail Market
This interactive chart shows the largest german sports retailers by revenue, total market size 2019, market shares and revenue development vs the previous year. This chart can be downloaded as JPG, PNG or PDF.
-
 Infographics & Data
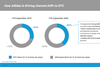
How Adidas is driving channel shift to DTC
This chart shows the DTC-share of total net revenues in Q3 2020 vs Q3 2019. This chart can be downloaded as JPG, PNG or PDF.
-
 Infographics & Data
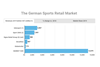
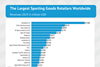
Ranking - The Largest Sporting Goods Retailers Worldwide
This exclusive chart shows the revenue development of the major global sporting goods retailers in 2019 vs 2018. The chart and data can be downloaded. This is exclusive data and analysis for Premium Members.
-
 Infographics & Data
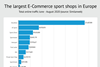
Ranking - The largest e-commerce sports shops in Europe
This exclusive chart shows the largest e-commerce sports shops in Europe ranked by website visitors. Included are sporting goods retailer and e-tailer. The chart and data can be downloaded. This is exclusive data and analysis for Premium Members.
-
 Infographics & Data
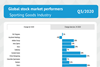
Ranking - Global stock market performers - Q3 2020 Update
This exclusive chart shows the share price development of the major stock listed sporting goods companies in Q3 2020 and since the beginning of 2020. The chart and data can be downloaded. This is exclusive data and analysis for Premium Members.
-
 Infographics & Data
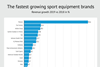
Ranking - The fastest growing sports equipment brands
This exclusive chart shows the fastest growing sports equipment brands, including Peloton, Fox Factory, Adidas, Garmin, Yeti, Johnson Health Tech, K2/Marker/Völkl, Callaway, Peak Achievement Athletics, Scott Sports. Ranking by %-growth vs last year. The chart and data can be downloaded. This is exclusive data and analysis for Premium Members.

