

All Data Visuals articles – Page 5
-
 Infographics & Data
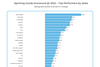
Sporting Goods Scorecard Q1 2022 - The top performers by sales and profit
This exclusive chart and data can be downloaded by our Premium Members.
-
 Infographics & Data
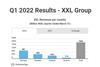
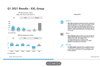
Q1 2022 Results XXL Group
This earnings briefing includes the highlights of the Q1 2022 for XXL Group
-
 Infographics & Data
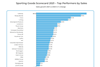
Sporting Goods Scorecard 2021 - The top performers by sales and profit
With our exclusive Sporting Goods Scorecard, we give you an overview of top performers by sales and profit for FY 2021. Find out about the winners and losers in the industry. The Scorecard includes the revenue and profit development of all major global sporting goods brands. The chart can be downloaded. This is exclusive data and analysis for Premium Members.
-
 Infographics & Data
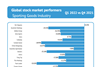
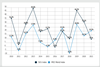
Global sports industry stock market performers - Q1 2022
This exclusive interactive chart shows compares the stock performance of the top public companies in the sporting goods industry from Q4 2021 to Q1 2022. The chart can be downloaded. This is exclusive data and analysis for Premium Members.
-
 Infographics & Data
Comparison of Yue Yuen’s shoe-producing regions by volume
This interactive chart compares Yue Yuen’s shoe-producing regions by volume. The chart can be downloaded. This is exclusive data and analysis for Premium Members.
-
 Infographics & Data
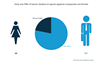
Gender breakdown of senior management at sports companies
This exclusive interactive chart shows the breakdown by gender of senior management at sports companies. The chart and data can be downloaded. This is exclusive data and analysis for Premium Members.
-
 Infographics & Data
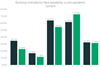
Infographic - SGI’s Sporting Goods Index vs MSCI Index - 2021 Update
This exclusive chart shows the development of the top 88 stock listed sporting goods companies in comparison with the MSCI Index over the past 11 years (2010 to 2021).
-
 Infographics & Data
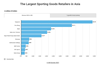
Top sporting goods retailers in Asia
This exclusive interactive chart ranks the top sporting goods retailers in Asia by revenues in USD for 2020 and percentage growth in their local currency. The charts and data can be downloaded. This is exclusive data and analysis for Premium Members.
-
 Infographics & Data
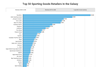
Top sporting goods retailers in Europe
This exclusive interactive chart ranks the top sporting goods retailers in Europe by revenues in USD for 2020 and percentage growth in their local currency. The charts and data can be downloaded. This is exclusive data and analysis for Premium Members.
-
 Infographics & Data
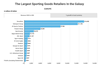
Top 50 Sporting Goods Retailers in the Galaxy
This exclusive interactive chart ranks the top 50 sporting goods retailers by revenues in USD for 2020 and percentage growth in their local currency. The charts and data can be downloaded. This is exclusive data and analysis for Premium Members.
-
 Infographics & Data
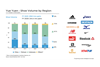
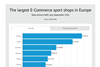
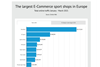
The largest e-commerce sports shops in Europe - Q3 2021 Update
This exclusive interactive chart shows the largest e-commerce sports shops in Europe ranked by the number of website visitors in Q3 2021, with % changes vs Q2 2021. Included are regular sporting goods retailers and pure e-tailers. The chart and data can be downloaded. This is exclusive data and analysis for Premium Members.
-
 Infographics & Data
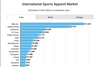
International sports apparel market 2020
This chart shows the revenues, growth and market share of the top 26 sports apparel brands in 2020 vs. 2019. The chart and data can be downloaded. This is exclusive data and analysis for Premium Members.
-
 Infographics & Data
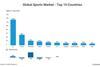
Top 10 countries leading the global sports market in 2020
This exclusive interactive chart shows total market size of sporting goods in the U.S., China, Germany, Japan, France, the U.K., Canada, South Korea, India and Italy for the year 2020. The chart can be downloaded. This is exclusive data and analysis for Premium Members.
-
 Infographics & Data
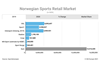
The Norwegian Sports Retail Market
This interactive chart shows the largest norwegian sports retailers by revenue in NOK (2019 and 2020) as well as the total market size 2019, 2020 including market shares. This chart can be downloaded as JPG, PNG or PDF.
-
![Screenshot 2021-06-24 at 09-08-06 Exclusive Research Study – The Sports Brands Winning The Online Race In Germany - LINK In[...]](https://d1f00kj7ad54bu.cloudfront.net/Pictures/100x67/6/3/1/8631_screenshot20210624at090806exclusiveresearchstudythesportsbrandswinningtheonlineraceingermanylinkin..._218957_crop.png) Infographics & Data
Infographics & DataBest-performing sports brands in the German online market
This is an extract of the research study The sports brands winning the online race in Germany in which we analysed 60 leading sports brands in Germany.
-
 Infographics & Data
Running motivations: new pandemic vs pre-pandemic runners
Source: RunRepeat The report is available online.
-
 Infographics & Data
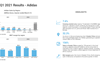
Earnings - Q1 2021 Results Adidas
This earnings briefing includes the highlights of the Q1 2021 from Adidas.
-
 Infographics & Data
The largest e-commerce sports shops in Europe - Q1 2021 Update
This exclusive interactive chart shows the largest e-commerce sports shops in Europe ranked by the number of website visitors in Q1 2021, with % changes vs June-August 2020. Included are regular sporting goods retailers and pure e-tailers. The chart and data can be downloaded. This is exclusive data and analysis for Premium Members.
-
 Infographics & Data
Q1 2021 Results XXL Group
This earnings briefing includes the highlights of the Q1 2021 for XXL Group
-
 Infographics & Data
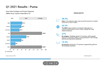
Earnings - Q1 2021 Results Puma
This earnings briefing includes the highlights of the Q1 results 2021 from Puma

