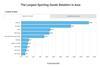
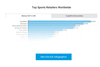
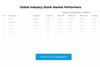
This exclusive chart shows the development of the top 88 stock listed sporting goods companies in comparison with the MSCI Index over the past 11 years (2010 to 2021).
For more analysis and rankings check our Analysis section - it includes our exclusive industry analysis including our annual ranking of the global stock listed sporting goods companies (by market capitalization), the largest global sporting goods retailers, the analysis of European retail landscape as well as analysis and rankings in the athletic apparel, athletic footwear and sports equipment industry segment.