
Latest Data, Analysis & Infographics – Page 11
-
 Infographics & Data
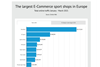
The largest e-commerce sports shops in Europe - Q1 2021 Update
This exclusive interactive chart shows the largest e-commerce sports shops in Europe ranked by the number of website visitors in Q1 2021, with % changes vs June-August 2020. Included are regular sporting goods retailers and pure e-tailers. The chart and data can be downloaded. This is exclusive data and analysis for Premium Members.
-
 Infographics & Data
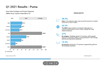
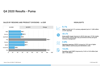
Earnings - Q1 2021 Results Puma
This earnings briefing includes the highlights of the Q1 results 2021 from Puma
-
 Infographics & Data
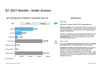
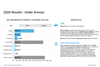
Earnings - Q1 2021 Results Under Armour
This earnings briefing includes the highlights of the earnings results of Q1 2021 from Under Armour
-
 Infographics & Data
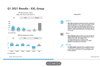
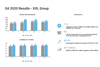
Q1 2021 Results XXL Group
This earnings briefing includes the highlights of the Q1 2021 for XXL Group
-
 Infographics & Data
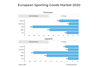
European Sports Sporting Goods Market 2020
The market for sports clothing and footwear fell by 8 percent to €28.3 billion in the five major European countries in 2020, according to revised estimates from NPD Group.
-
 Infographics & Data
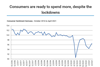
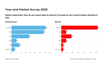
Consumer Sentiment Germany
This infographic shows the consumer sentiment development in Germany until April 2021 - surveyed by the HDE (Handelsverband Deutschland)
-
 Article
Sporting goods industry stocks rose by 10.9% in Q1 2021
Confirming the resilience of our industry, the average stock market value of 38 selected public companies in the sporting goods sector advanced by 10.9 percent in the first three months of 2021. Comparatively, the main stock indices grew by only between 2.4 percent and 8.5 percent over the period.
-
 Infographics & Data
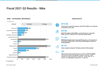
Earnings - Fiscal 2021 Q3 Results - Nike
This earnings briefing includes the highlights of the fiscal 2021 financial results (Q3 ending 28.02.2021) from Nike.
-
 Infographics & Data
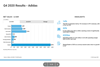
Earnings - Q4 2020 and FY 2020 Results Adidas
This earnings briefing includes the highlights of the Q4 results and FY 2020 from Adidas.
-
 Infographics & Data
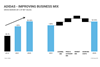
Infographic Adidas - Improving Business Mix
This infographic shows gross margin improvement from Adidas from 48,3% in 2015 to expected ~52% in 2021. It also shows how Adidas is planning to increase the gross margin further to 53% to 55% by 2025.
-
 Article
The Norwegian market grew by over 7% in 2020
Norway has the highest per capita consumption for sporting goods in Europe, and it grew strongly last year – in spite or because of the coronavirus epidemic – in contrast with an overall sales decline estimated at around 10 percent in the five major European countries. One main reason was ...
-
 Infographics & Data
Earnings - Q4 2020 and FY 2020 Results Puma
This earnings briefing includes the highlights of the Q4 results and FY 2020 from Puma
-
 Infographics & Data
Earnings - 2020 Results Under Armour
This earnings briefing includes the highlights of the report results of 2020 and the Outlook 2021 from Under Armour
-
 Infographics & Data
Infographic - 2021 Sales Outlook for the European Outdoor industry
This infographic includes the results of a recent study conducted by the European Outdoor Group. It shows the expected sales development (at retail and wholesale level) in Europe in 2021 from the surveyed Outdoor Brands.
-
 Infographics & Data
Earnings - Q4 2020 Results XXL Group
This earnings briefing includes the highlights of the Q4 2020 Interim Report of XXL Group
-
 Infographics & Data
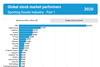
Ranking - Global stock market performers 2020
This exclusive chart shows the ranking of the largest listed sporting goods companies in 2020 by market capitalization. The chart can be downloaded in JPG, PNG or PDF format. This is exclusive data for Premium Members.
-
 Infographics & Data
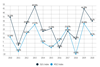
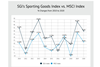
Infographic - SGI’s Sporting Goods Index outperforms MSCI Index - 2020 Update
This exclusive chart shows the development of the top 86 stock listed sporting goods companies in comparison with the MSCI Index over the past 10 years (2010 to 2020).
-
 Analysis
Analysis: Sporting goods industry stocks surged by 32% in Covid year
This exclusive chart shows the development in the market capitalization of the top 86 stock-listed sporting goods companies between the end of 2019 and the end of 2020. This is exclusive data and analysis for Professional Members.
-
 Article
Diversity and inclusion bring benefits for Puma and other companies
In 2020, the year of the Black Lives Matter (BLM) protests, diversity and inclusion burst onto the public agenda. The theme has emerged on companies’ radars, too. Diversity and inclusion are increasingly criteria by which companies are evaluated, and they are producing many positive results. While some footwear and sportswear ...
-
 Article
Industry Insights: How to find new B2B business in a digitalized market
- a contribution by Martin Kössler, CEO of Huginbiz® (*) - The past spring created for most of us a feeling of pandemic panic and business paralysis. Offices were shut down and most employees were asked to work from home. From a pure productivity perspective, it gave ...

