

All Sporting Goods Scorecard articles – Page 2
-
 Infographics & Data
SGI Sporting Goods Scorecard Q4 2022
Find out whose sales are up and whose profits are down in Q4 2022 in our exclusive analysis of the sporting goods industry’s largest players.
-
 Infographics & Data
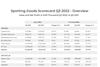
Analysis: Sporting Goods Scorecard - Q3 2022
Our Q3 Scorecard includes the revenue and profit development of 41 major sporting goods companies - benchmark yourself with the top players in the industry
-
 Article
Analysis: Sporting Goods Scorecard Q3 2022 – The top performers by sales and profit
Our Q3 Scorecard includes the revenue and profit development of 42 major sporting goods companies.
-
 Article
Analysis: Sporting Goods Scorecard Q2 2022 - The top performers by sales and profit
Our Scorecard includes the revenue and profit development of 43 major sporting goods companies.
-
 Infographics & Data
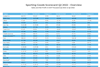
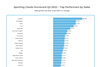
Sporting Goods Scorecard Q2 2022 - The top performers by sales and profit
This exclusive chart and data can be downloaded by our Premium Members.
-
 Infographics & Data
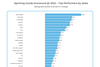
Sporting Goods Scorecard Q1 2022 - The top performers by sales and profit
This exclusive chart and data can be downloaded by our Premium Members.
-
 Article
Analysis: Sporting Goods Industry Scorecard Q1 2022
Find out about the top industry performers. With our first quarter 2022 Sporting Goods Industry Scorecard, we provide an overview by sales and profit.
-
 Infographics & Data
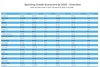
Sporting Goods Scorecard 2021 - The top performers by sales and profit
With our exclusive Sporting Goods Scorecard, we give you an overview of top performers by sales and profit for FY 2021. Find out about the winners and losers in the industry. The Scorecard includes the revenue and profit development of all major global sporting goods brands. The chart can be downloaded. This is exclusive data and analysis for Premium Members.
-
 Analysis
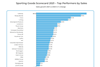
Sporting Goods Industry Scorecard 2021
Exclusive: We give you an overview of top performers by sales and profit.
- Previous Page
- Page1
- Page2
- Next Page

