

Ask an AI assistant which running shoe to buy, and the answer arrives fully formed. Behind it lies the model’s picture of every brand it knows, shaped long before anyone asked the question. That picture is what Pitot Group sets out to measure.
The London strategy, marketing and AI firm runs the Pitot Index, which rates every week how well AI systems understand brands and publishes the scores free on pitotindex.com. Each cycle, nine pinned models built by developers in the West, China and the Arabic-speaking world answer the same questions, written by Pitot for the purpose.
Nobody tells the models what brands to talk about: they pick them on their own. Those brands are then scored on a 100-point scale across five dimensions, defined below.
Salience, how readily the models name a brand unprompted, is reported separately and is not part of the score. Source: Pitot Index; Andrea Maticevic.
For this first edition of The Quarterly AI Check, Pitot compiled a sportswear summary of its Q3 2026 report for SGI Europe readers. Founder Andrea Maticevic answered our questions and contributed the commentary at the end of this piece.
What the model holds before the prompt
The difference from the AI visibility tools many marketing teams already use is where the reading is taken. Those tools look at answers once a person’s prompts, history and preferences have shaped them. Pitot looks at the model before that. “Volume gets you named; coherence gets you understood,” Maticevic says.
“When nine models disagree about you, the problem is rarely the models.”
Nike leads. The detail underneath is more interesting.
| Rank | Brand | Q3 score | In the top ten |
| 1 | Nike | 75.6 | 11 of 11 |
| 2 | Adidas | 72.8 | 11 of 11 |
| 3 | Asics | 72.2 | 11 of 11 |
| 4 | New Balance | 69.6 | 11 of 11 |
| 5 | Lululemon | 69.4 | 11 of 11 |
| 6 | Puma | 65.9 | 11 of 11 |
| 7 | Under Armour | 61.5 | 11 of 11 |
| 8 | Fila | 60.3 | 11 of 11 |
| 9 | Reebok | 59.0 | 11 of 11 |
| 10 | The North Face | 15.0 | 2 of 11 |
| 11 | Salomon | 14.1 | 2 of 11 |
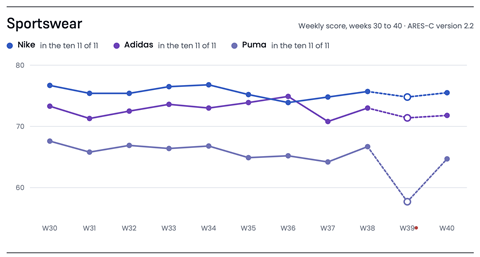
Industry average: 67.4. Nike was 1st in 10 of 11 cycles; Nike, Adidas and Asics held the top three in 8 of 11. Weeks outside the top ten count as zero, which explains the low scores of The North Face and Salomon. Week 39 is flagged and excluded. Method: ARES-C 2.2. Source: Pitot Index, Sportswear Q3 2026 report. Chart: SGI Europe.
Named first, understood less
Ask the models to talk about sportswear unprompted and Puma comes up readily: it ranks 3rd of 14 brands on salience, with a score of 89.0. Under Armour is 4th (80.2), Asics only 6th (72.1). Rate how well the models understand those brands, though, and the order flips. Asics is 3rd in Q3 on 72.2, Puma 6th on 65.9 and Under Armour 7th on 61.5.
Puma is 3rd for being brought up and 6th for rating; Asics is the reverse. Source: Pitot Index, Sportswear Q3 2026 report. Chart: SGI Europe.
On Authority the three are almost level, between 58.3 and 60.9, and Puma leads on Context (67.7) and Signal Consistency (92.3). The gap opens on Reputation, where Asics scores 73.8 against 59.5 for Puma and 47.7 for Under Armour, and onExpertise Visibility, where Asics leads the whole field on 75.8.
According to Maticevic, the models put quality at the core of Asics and treat its GEL cushioning as a benchmark.
They know Puma for motorsport and its ties to music, lifestyle and fashion, but read it as a follower in performance technology, with roughly three in four of their assessments mentioning inconsistent quality. Under Armour gets credit for performance fabrics and little beyond that niche. “These are the models’ descriptions, not ours,” Maticevic says. “We don’t make the rules, we are the messenger.”
Visibility, in his view, is a result. The rating looks at the cause.
Nike’s lead, and its weak spot
Nike ranked 1st in 10 of 11 Q3 cycles. In week 44 it stood on 76.1, a lead of 2.8 points, and has now been 1st in 14 of 15 published cycles. Across the quarter it topped all 14 brands on Authority (81.8) and Context (88.3) and came 2nd on Expertise Visibility (75.0). On Reputation it scored 52.5, 12th of 14.
1st on Authority and Context, 12th of 14 on Reputation. Source: Pitot Index, Sportswear Q3 2026 report. Chart: SGI Europe.
Adidas shows a similar shape at a lower level: 3rd on Authority (66.6), 2nd on Context (85.6), 10th on Reputation (57.2). How a lead built that way holds up is the starting point of Maticevic’s commentary below.
Source: Pitot Index, Sportswear Q3 2026 report. Chart: SGI Europe.
Sport, fashion or both?
Nike and Adidas also turn up in the models’ answers on mainstream fashion, so Pitot rates each of them in both categories. In Q3, Nike made the fashion top ten in 6 of 11 cycles and Adidas in 5. Puma, although it beats both Asics and Under Armour on Context, never made it
The North Face, meanwhile, made the sportswear top ten in only two Q3 cycles, both times in 2nd place, and was 2nd again in week 44 on 73.3.
Moving models, moving web
AI models change all the time, and the same model name can hide a different system from one week to the next. Maticevic treats that as part of the measurement. “The test stays the same, so the movement is theirs,” he says. Pitot logs the model it is actually served next to the one it requested. In September it found that two providers had swapped the model behind a pinned name without notice, and it re-pinned. It also tracks how often a model’s answer shifts with no brand news behind it.
“A brand that has moved by less than its models’ own variation has not moved,”
Maticevic says.
| Place | Brand | Score | Change | Week 43 |
| 1 | Nike | 76.1 | +0.6 | 1 |
| 2 | The North Face | 73.3 | -0.6 | 2 |
| 3 | Adidas | 73.0 | +0.7 | 4 |
| 4 | Asics | 72.0 | -1.0 | 3 |
| 5 | New Balance | 71.1 | +0.5 | 5 |
| 6 | Lululemon | 69.3 | -0.1 | 6 |
| 7 | Columbia Sportswear | 66.4 | +0.1 | 8 |
| 8 | Puma | 66.3 | -1.2 | 7 |
| 9 | Under Armour | 60.5 | -0.2 | 9 |
| 10 | Reebok | 59.5 | +1.5 | 10 |
4 of 10 brands changed place since week 43; 16.6 points separate 1st and 10th. Weekly scores from week 41 use ARES-C 2.3; Q3 figures use 2.2. Source: Pitot Index, Sportswear, week 44. Chart: SGI Europe.
A newer tool, Signal Divergence, still in beta, compares the Index reading with a reading of the live web, which picks up news the trained models haven’t absorbed yet. In week 44, the live web rated Asics 4.6 points above its Index score of 72.0 and New Balance 3.7 points above. Lululemon (minus 3.7), Under Armour (minus 2.9) and Nike (minus 1.2) went the other way. Pitot says wide gaps may anticipate later movements in the models, but it is still studying what they mean.
| Place | Brand | Index | Live web | Difference |
| 1 | Nike | 76.1 | 74.9 | -1.2 |
| 2 | The North Face | 73.3 | 73.7 | +0.4 |
| 3 | Adidas | 73.0 | 74.8 | +1.8 |
| 4 | Asics | 72.0 | 76.6 | +4.6 |
| 5 | New Balance | 71.1 | 74.8 | +3.7 |
| 6 | Lululemon | 69.3 | 65.6 | -3.7 |
| 7 | Columbia Sportswear | 66.4 | 63.8 | -2.6 |
| 8 | Puma | 66.3 | 66.4 | +0.1 |
| 9 | Under Armour | 60.5 | 57.6 | -2.9 |
| 10 | Reebok | 59.5 | 61.4 | +1.9 |
Index: score from the trained AI models. Live web: reading of the latest news the models have not yet absorbed. Difference is the live web reading minus the Index reading, in points. Industry average: live web 69.0, Index 68.8. Signal Divergence is in beta. Source: Pitot Index, Sportswear, week 44. Chart: SGI Europe.
What’s next
Maticevic’s advice starts with reading which dimension is weak, because each points to a different part of the company. On Expertise Visibility he is blunt: if a brand’s capability isn’t documented somewhere the models trust, “for the model it did not happen, period.”
For established leaders, the Nike and Adidas data point to Reputation, which more content won’t repair. Maticevic warns against adding material to a scattered brand image without knowing why it is scattered, a process Pitot calls Brand Drift: a quick gain now, and more noise for the next models to learn from. Ownership, he says, sits with the brand owner, normally the CMO with the CEO watching, “not the SEO team or the agency.”
For challengers, Asics shows that understanding can beat recall. Documented technical credibility counts, and independent sources count most. As AI agents start making purchases on a shopper’s behalf, Maticevic sees the stakes rising: a brand the machine doesn’t understand isn’t low on the list, it is “not on it.”
Nobody can yet say how long a correction takes, and Maticevic says to be wary of anyone who gives a number. Some models react to the live web within weeks; others wait for their next training update.
“AI models have no view of their own,” he says. What they return is assembled from what people have written and said about a brand, which is why Pitot calls the Index the Mirror:
“it reflects everything that is said about you today and was said about you yesterday, and it will define what is said about you tomorrow.”
Commentary: What AI really says about your brand, and why it matters
By Andrea Maticevic, founder, Pitot Index
Andrea Maticevic reads the sportswear results for SGI Europe readers. Weekly figures are as of week 44 (cycle 2026-W44).
A customer’s allegiance to a brand is a powerful thing. It means mistakes are tolerated, experiments are possible, and good PR can do miracles to recover a bad situation. We like to believe our minds are driven only by logic, but sometimes we buy things with our heart, then try to justify the purchase with logic. This happens in the luxury world, as in any other environment. This is why commercials must mean something, and why we still remember campaigns from thirty years ago.
Brand allegiance still plays a huge role, but it only works on existing customers and on people who already feel an affinity with the brand. Filling the top of the funnel is a priority, and nowadays a new channel for discoverability has opened. The AI-mediated world is here and now, it’s expanding every day, and doesn’t work like anything else seen before.
AI visibility measurement is based on real or simulated human interactions with the AI world, excellent at measuring trends, and what people say about your brand today. Critical intel. But it also means the measurement adds the emotional level typical of humans, in a measurement that will change with the question.
What happens before the human layer? How is a digital system reading the sum of all your brand’s available information? What is its cold, unemotional opinion of you?
This is not about visibility, this is not about sentiment. This is about the base from which AI decides what surfaces, when and how, before a person enters the equation. This is about how your brand is seen, with no filters.
Why measure that? Because if you get this part wrong, the damage will compound. Add content on top of it blindly, and brand coherence will be diluted at the next AI training round, calling for even more costly corrective action. If you get this right, every euro you put into AEO and GEO works much harder.
Because an AI has no allegiance. Doesn’t like or dislike your brand. It forms its view on everything it has absorbed about you: what you say, what others say, and how they react. Good and bad.
That means a genuinely strong brand, established and, most importantly, built on strong foundations, will navigate steadily through great challenges.
I can’t think of a better example than the current sportswear leader, Nike.
Nike is 1st again, on 76.1 and 2.8 points clear. It has been 1st in 14 of the 15 published cycles. The third quarter shows what that lead is built on: across Q3, the models placed Nike 1st of 14 on Authority and on Context, and 12th of 14 on Reputation, near the bottom of the field.
In our view, a brand can be recognized for authority and context while the answers about it still weigh heavily on criticism.* These readings describe what the AI models output, not our opinion of any brand or a statement about its quality or conduct.
And still Nike holds the lead, week after week. On Authority, the models read it as setting the terms of its industry rather than following them. Almost all of their assessments of capability against marketing presence place the two evenly, which in our view says a lot about how well that marketing works.
That is the definition of AI-readable brand power.
Another great example to cite is The North Face. A very well-known brand across the globe, it made the measured top ten only five times in the last 15 published cycles. A brand’s absence from the measured ten in a cycle usually means the models brought it up less readily that week than the brands that made the ten. Every time it did, however, it went straight to the second step of the podium: 2nd, as it is this week, on 73.3.
So the models know the brand well enough to rate it highly when they bring it up. In our view, the pattern can mean they do not agree whether it belongs in sportswear to start with.
The regional readings add a twist. In the third quarter, the MEA reading placed The North Face 1st both times it made the ten. That says nothing about how the brand performs in that market, but it tells us how models developed in those regions rate it.
Bottom line, a great brand can also be penalized in the AI-mediated world. Both realities can be true, but one needs immediate action, because the digital misalignment compounds.
The models also name Nike and Adidas in two industries, sportswear and mainstream fashion, so the Index measures both brands in both. This week Adidas scores almost the same in each: 73.0 in sportswear, 72.2 in mainstream fashion. Nike scores 76.1 in sportswear and 73.5 in mainstream fashion, 2.6 points lower.
Puma is the opposite case. In the third quarter, the models placed it ahead of Asics and Under Armour on Context, linking it to fashion, lifestyle and music. Yet it has not made the mainstream fashion ten in any published cycle.
Context, in the Index, is where the models place the brand, and what they associate it with beyond its own category. In our view, these figures can mean the models place Adidas as firmly in fashion as in sport, while Nike’s standing is stronger in sport. For Puma, they can mean the models link it to fashion without yet placing it among fashion’s leading names. For three brands chasing the same customer on the track and on the street, that is worth knowing.
The bottom line
Ignore the issue, and your digital brand identity will become what the AI-mediated world says. Act now, and you will gain a once-in-a-lifetime strategic advantage.
(* These are the models’ descriptions. We have not assessed the underlying matters.)
About Pitot Group
Pitot Group is a London strategy, marketing and AI firm that develops its own measurement tools. Its Pitot Index, founded by Andrea Maticevic, rates how well AI models understand brands in 14 industries every week. On Oct. 12, the company launched its first paid quarterly reports, covering 13 industries, alongside Pulse, a brand health check. It also offers audits, advisory work and marketing automation tools.
About the Pitot Index
- Sources: Pitot Index, Sportswear Q3 2026 report, summary compiled for SGI Europe; Pitot Index, Sportswear, week 44 (cycle 2026-W44).
- Method: Nine pinned AI models built by Western, Chinese and Arabic-first developers take one fixed, unprompted test each week. Pitot Group drafts the questions rather than taking them from real users’ queries, and the models choose which brands to talk about. Scoring is automated, on a 100-point scale across five dimensions. 14 brands are measured in sportswear.
- Period: Q3 covers the 11 weekly cycles from week 30 to week 40. Week 39 is flagged and excluded from averages because one AI system left most questions unanswered. A brand’s Q3 score is the average of its ten valid weekly scores, with weeks outside the top ten counted as zero.
- Method version: Q3 figures run on ARES-C 2.2. Since week 41, weekly scores run on ARES-C 2.3, so week 44 figures cannot be compared directly with Q3.
- Signal Divergence: In beta.
- Disclosure: Pitot Group also sells audits and consulting to brands, some of which it rates, and says no paying client can change a score. Ratings describe model output under a fixed test and are not verdicts on how good a brand is or how it behaves.
- Access: Weekly scores are free on pitotindex.com. Quarterly sector reports are sold under license.