

All Fox Factory articles
-
 Analysis
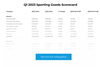
The top sporting goods industry performers by sales and profits in Q2 2025
The 43 publicly traded companies in our quarterly scorecard have experienced a significant 45 percent decline in aggregated profits.
-
 Analysis
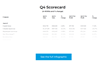
The top sporting goods industry performers by sales and profits in Q1 2025
Key market players are still in turnaround mode as the sporting goods industry reports its first results of 2025.
-
 News briefs
Sale of Marucci Sports completed
Compass Diversified (CoDi) has completed the previously announced sale of its majority-owned subsidiary, Wheelhouse Holdings, Inc., the parent company of Marucci Sports, LLC, to Fox Factory Holding Corp. The sale price was based on an enterprise value of $572 million, subject to certain working capital and other adjustments. After these ...
-
 News briefs
CoDi’s divestiture of Marucci will benefit the company
Compass Diversified’s decision to divest its Marucci Sports business to Fox Factory for $572 million after purchasing the brand for $200 million in 2020 will help the company reduce its cost of capital and give it “greater ability to increase shareholder returns,” it said in a statement. In Q3 ...
-
 Infographics & Data
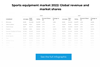
Sports equipment market 2022: Global revenue and market shares
Our infographic has the 2022 market sales and revenue numbers for 39 big names in Sporting Equipment for those who need the numbers fast.
-
 Analysis
Analysis: The top sporting goods industry performers by sales and profits in Q2 2023
Facing difficult year-over-year comparisons in many cases, 2/3 of entrants reported lower sales from Q2 2022. Find out more with our scorecard.
-
 Infographics & Data
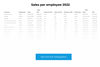
Sales per employee 2022 at sporting goods companies
Our downloadable infographic has employee numbers and sales per employee at 25 of some of the world’s biggest sporting goods companies.
-
 Article
Analysis: Double-digit increase in sales per employee in 2022
We bring you employee numbers at the world’s biggest sporting goods companies, sales per employee, and how these compare with other industries.
-
 Infographics & Data
SGI Sporting Goods Scorecard Q1 2023
How did Apparel, Footwear, Equipment and Retail perform in the first quarter of 2023? Our Sporting Goods Industry Scorecard has the answer.
-
 Infographics & Data
SGI Sporting Goods Scorecard Q4 2022
Find out whose sales are up and whose profits are down in Q4 2022 in our exclusive analysis of the sporting goods industry’s largest players.
-
 Analysis
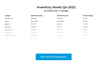
Analysis: Taking stock of sporting goods inventory levels
Our exclusive analysis of the inventory levels of some of the industry’s biggest brands, including how some are responding to the challenges
-
 Infographics & Data
Sporting goods company inventory levels in Q4 2022
We’ve compiled inventory levels at the top sporting goods companies in Q4 2022. Found out how they compare with 2021 and across the industry
-
 Infographics & Data
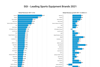
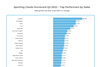
Leading sports equipment brands 2021
This exclusive chart and data can be downloaded by our Premium Members.
-
 Infographics & Data
Sporting Goods Scorecard Q2 2022 - The top performers by sales and profit
This exclusive chart and data can be downloaded by our Premium Members.
-
 Infographics & Data
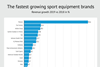
Ranking - The fastest growing sports equipment brands
This exclusive chart shows the fastest growing sports equipment brands, including Peloton, Fox Factory, Adidas, Garmin, Yeti, Johnson Health Tech, K2/Marker/Völkl, Callaway, Peak Achievement Athletics, Scott Sports. Ranking by %-growth vs last year. The chart and data can be downloaded. This is exclusive data and analysis for Premium Members.

