
Latest Data, Analysis & Infographics – Page 7
-
 Infographics & Data
The circular economy explained in pictures
The circular economy is counter to the current linear “take-make-waste” economy; exploiting resources for manufacture, finite product life, and one which ends with disposal. The circular economy differentiates between two types of circular loops: Biological and technical. Products should be designed and produced in a way that all its raw materials can be reintegrated into either one of the loops at the end of its life.
-
 Article
Circular economy in the textile industry in pictures
The principles of the circular economy in textile production are counter to the current linear “take-make-waste” process in the textile industry; exploiting resources for manufacture, finite product life, and one which ends with disposal. The circular economy differentiates between two types of circular loops: Biological and technical. In the textile ...
-
 Infographics & Data
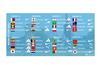
FIFA World Cup 2022’s kit sponsors
These exclusive chart links the sportwear sponsors with their kits by national team for this year’s World Cup, in Qatar.
-
 Infographics & Data
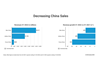
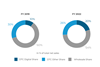
H1 sales growth in China for Nike, Adidas, Puma
This exclusive analysis shows the three top sportswear companies’ first-half revenue and year-on-year revenue growth in China for 2022.
-
 Article
Roblox surveys its own metaverse
According to Roblox’s “Metaverse Fashion Trends” report for 2022, the fashion world has embraced the immersive digital world – and customization is the name of the game for Gen Z in particular. People of this generation want not just to explore the metaverse but also to signal something about themselves ...
-
 Infographics & Data
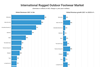
The international outdoor footwear market 2021
This exclusive, yearly analysis includes the market size as well as revenues, market shares and growth for the leading outdoor footwear brands for 2021 and 2020.
-
 Infographics & Data
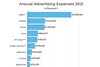
Annual advertising expenses 2021
These exclusive, yearly charts shows advertising expenses for 13 major global sportswear brands for the year 2021 and their year-on-year change.
-
 Article
Mobilization spurs demand for sports and outdoor products on the Russian market
The Russian market experienced a boom in demand for sporting and outdoor goods since Sept. 21, when the Russian president declared the first mass mobilization in the country since the second world war. The demand for military ammunition has sharply risen in Russia, and the price of sporting and outdoor ...
-
 Infographics & Data
DTC’s share in VF’s revenue
This infographic shows the rise in DTC Digital as a percentage of VF Corp.’s revenue.
-
 Article
Sporting goods industry stocks down in Q3
According to SGI Europe’s quarterly study of 40 select sporting goods industry stocks, the drop was less than in Q1 (-16.25%) and Q2 (-14.79%) but marked the third consecutive quarterly decline for the segment. But the results were mixed, as the stock prices of 19 companies – led by Xtep ...
-
 News briefs
Global squash equipment market to post 2.14% CAGR to 2026
The global squash equipment market is projected to grow by $75.2 billion from 2021 to 2026, marking a compound annual growth rate (CAGR) of 2.14 percent during the 2022-26 forecast period, according to a recent report by research and advisory firm Technavio. Growth is being driven primarily by the introduction ...
-
 News briefs
Global rugby equipment market to post 5.57% CAGR to 2026
The global rugby equipment market is projected to grow at a compound annual growth rate (CAGR) of 5.57 percent during the 2021-26 forecast period, representing market growth of $730.08 million, according to a new 120-page report by market research firm Technavio. Growth for 2022 is projected at 4.82 percent. The ...
-
 Infographics & Data
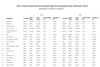
Sports Equipment Market 2021
This exclusive, yearly statistic includes revenue and market share development of the major global sports equipment brands.
-
 Infographics & Data
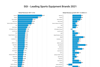
Leading sports equipment brands 2021
This exclusive chart and data can be downloaded by our Premium Members.
-
 Analysis
Market Analysis: The sports equipment market
This exclusive statistic includes revenue and market share development for the major global sports equipment brands.
-
 Article
McKinsey has some advice for inflationary times
Rising operational costs and increasingly skittish consumers are squeezing margins in the apparel industry. Below is what McKinsey advises.
-
 Article
Analysis: Sporting Goods Scorecard Q2 2022 - The top performers by sales and profit
Our Scorecard includes the revenue and profit development of 43 major sporting goods companies.
-
 Infographics & Data
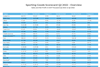
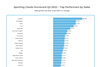
Sporting Goods Scorecard Q2 2022 - The top performers by sales and profit
This exclusive chart and data can be downloaded by our Premium Members.
-
 Infographics & Data
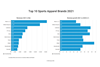
Top 10 Sports Apparel Brands 2021
This exclusive interactive chart shows revenues and year-on-year revenue growth for the top ten sports apparel companies of 2021. The chart can be downloaded. This is exclusive data and analysis for Premium Members.
-
 Article
Market Analysis: The sports apparel market
This is an exclusive, yearly statistic available only to subscribers of SGI Europe. It includes revenue and market-share development, as well as a regional breakdown, of the major global sports apparel brands.

