

All Sporting Goods Intelligence articles in Online Content – Page 8
-
 Infographics & Data
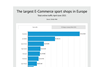
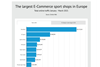
The largest e-commerce sports shops in Europe - Q2 2021 Update
This exclusive interactive chart shows the largest e-commerce sports shops in Europe ranked by the number of website visitors in Q2 2021, with % changes vs Q1 2021. Included are regular sporting goods retailers and pure e-tailers. The chart and data can be downloaded. This is exclusive data and analysis for Premium Members.
-
 Infographics & Data
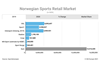
The Norwegian Sports Retail Market
This interactive chart shows the largest norwegian sports retailers by revenue in NOK (2019 and 2020) as well as the total market size 2019, 2020 including market shares. This chart can be downloaded as JPG, PNG or PDF.
-
 Infographics & Data
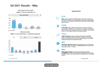
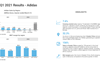
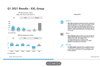
Earnings - Q4 2021 Results Nike
This earnings briefing includes the highlights of the Q4 ending May 31, 2021 from Nike.
-
 Market Reports
Market Report Sports 2021
The new edition of the Market REPORT Sports 2021 provides reliable facts and figures for all product groups and for all relevant distribution channels in the german market.
-
 Infographics & Data
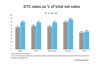
DTC sales of five major sports brands for 2019, 2020
This exclusive interactive chart shows the DTC sales of Adidas, Nike, Under Armour, VF Corp. and Puma as a percentage of total net sales for the financial years 2019 and 2020. The chart can be downloaded. This is exclusive data and analysis for Premium Members.
-
 Article
Growing demand for antimicrobial protection
Swedish firm Polygiene®, the market leader in branded antimicrobial and stay-fresh treated textiles, serving more than 200 global premium brands, has witnessed a big increase in new accounts and interest in product categories beyond apparel.
-
 Infographics & Data
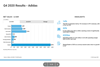
Earnings - Q1 2021 Results Adidas
This earnings briefing includes the highlights of the Q1 2021 from Adidas.
-
 Infographics & Data
The largest e-commerce sports shops in Europe - Q1 2021 Update
This exclusive interactive chart shows the largest e-commerce sports shops in Europe ranked by the number of website visitors in Q1 2021, with % changes vs June-August 2020. Included are regular sporting goods retailers and pure e-tailers. The chart and data can be downloaded. This is exclusive data and analysis for Premium Members.
-
 Infographics & Data
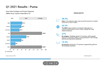
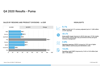
Earnings - Q1 2021 Results Puma
This earnings briefing includes the highlights of the Q1 results 2021 from Puma
-
 Infographics & Data
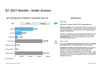
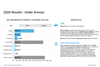
Earnings - Q1 2021 Results Under Armour
This earnings briefing includes the highlights of the earnings results of Q1 2021 from Under Armour
-
 Infographics & Data
Q1 2021 Results XXL Group
This earnings briefing includes the highlights of the Q1 2021 for XXL Group
-
 Infographics & Data
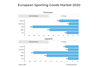
European Sports Sporting Goods Market 2020
The market for sports clothing and footwear fell by 8 percent to €28.3 billion in the five major European countries in 2020, according to revised estimates from NPD Group.
-
 Infographics & Data
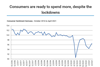
Consumer Sentiment Germany
This infographic shows the consumer sentiment development in Germany until April 2021 - surveyed by the HDE (Handelsverband Deutschland)
-

-
 Infographics & Data
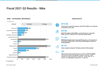
Earnings - Fiscal 2021 Q3 Results - Nike
This earnings briefing includes the highlights of the fiscal 2021 financial results (Q3 ending 28.02.2021) from Nike.
-
 Marketplace
Supreme Contacts GmbH
Supreme Contacts is one of the leading international matchmaking platforms for the lifestyle sector, quickly and efficiently bringing together, brands and sales partners. The focus is on the sports, shoes and fashion industries. With over 40,000 international sales contacts to brands, distributors, sales agencies and area sales ...
-
 Infographics & Data
Earnings - Q4 2020 and FY 2020 Results Adidas
This earnings briefing includes the highlights of the Q4 results and FY 2020 from Adidas.
-
 Infographics & Data
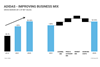
Infographic Adidas - Improving Business Mix
This infographic shows gross margin improvement from Adidas from 48,3% in 2015 to expected ~52% in 2021. It also shows how Adidas is planning to increase the gross margin further to 53% to 55% by 2025.
-
 Infographics & Data
Earnings - Q4 2020 and FY 2020 Results Puma
This earnings briefing includes the highlights of the Q4 results and FY 2020 from Puma
-
 Infographics & Data
Earnings - 2020 Results Under Armour
This earnings briefing includes the highlights of the report results of 2020 and the Outlook 2021 from Under Armour

