

All Sporting Goods Intelligence articles in Online Content – Page 4
-
 Infographics & Data
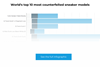
The most faked sneaker models
One brand dominates, but with which iconic line? Our infographic shows the RRP, counterfeit price and resale value of the 10 most counterfeited sneakers.
-
 Infographics & Data
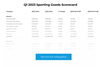
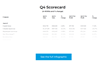
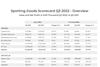
SGI Sporting Goods Scorecard Q1 2023
How did Apparel, Footwear, Equipment and Retail perform in the first quarter of 2023? Our Sporting Goods Industry Scorecard has the answer.
-
 Article
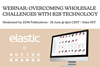
Free Webinar: Overcoming wholesale challenges with B2B e-commerce technology
Join Elastic Suite and Active Brands for our next EDM Expert Talk, to discuss how technology can help leading enterprises and industry disruptors overcome challenges in today’s wholesale environment. Technology enables B2B commerce to go from transactional to transformational, bringing shared success to brands, distributors, retailers and the end consumer.
-
 Infographics & Data
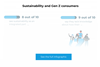
Sustainability and Gen Z Consumers
We bring you some key numbers from the latest research into Gen Z consumers and their thoughts on sustainability. See what 9 out of 10 think.
-
 Infographics & Data
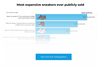
The most expensive sneakers ever publicly sold
The sneaker resale market is worth almost $30bn, set to increase to $100bn by 2026. We look at the most expensive sneakers ever sold.
-
 Analysis
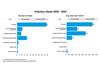
Analysis: Sporting Goods Scorecard Q4 2022 – The top performers by sales and profit
Our Q4 Scorecard includes the revenue and profit development of 48 major sporting goods companies.
-
 Infographics & Data
SGI Sporting Goods Scorecard Q4 2022
Find out whose sales are up and whose profits are down in Q4 2022 in our exclusive analysis of the sporting goods industry’s largest players.
-
 Infographics & Data
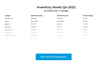
Sporting goods company inventory levels in Q4 2022
We’ve compiled inventory levels at the top sporting goods companies in Q4 2022. Found out how they compare with 2021 and across the industry
-
 Infographics & Data
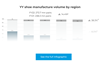
Yue Yuen’s 2022 shoe manufacture volume by region
We bring you a breakdown of Yue Yuen’s shoe manufacture volume by region
-
 Infographics & Data
European 2022 retail sell-out sales across outdoor segments
We bring you a breakdown of retail sell-out sales across six outdoor segments in 2022 across six European countries
-
 Infographics & Data
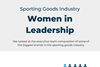
Gender and leadership in the sporting goods industry
How many women are on the executive teams and boards in the sporting goods industry? Find out in our latest exclusive interactive graphic.
-
 Infographics & Data
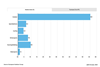
Sporting goods deals 2016-2021
What was the average deal size and which category had the most deals 2016-2021? Find out in our latest interactive graphic.
-
 Infographics & Data
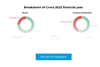
Crocs 2022 financial year revenue in detail
See how Crocs’ revenue for 2022 breaks down in our latest graphic.
-
 Infographics & Data
Analysis: Sporting Goods Scorecard - Q3 2022
Our Q3 Scorecard includes the revenue and profit development of 41 major sporting goods companies - benchmark yourself with the top players in the industry
-
 Infographics & Data
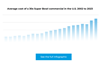
Average cost of a 30 second Super Bowl commercial in the U.S. 2002 to 2023
Found out how dramatically the cost of advertising at the Super Bowl has increased in our latest graphic.
-
 Infographics & Data
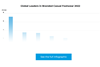
Global leaders in branded casual footwear 2022
Found out who were the leading casual footwear brands in 2022 in our latest graphic.
-
 Infographics & Data
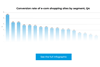
Conversion rate of e-com shopping sites by segment, Q4
See the conversion rates of various e-com segments in Q4, including four sporting apparel and footwear categories, in our graphic.
-
 Webinar
Watch now: How to get your supply chain data compliance-ready
Our latest free EDM Expert Talk in partnership with TrustTrace. We provide you with a practical roadmap to getting your data ready for compliance.
-
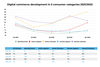 Infographics & Data
Digital commerce development in 5 consumer categories 2021/2022
See the changes in digital commerce revenue of the last 12 months in sporting goods, footwear, apparel and more in our graphic.
-
 Sponsored
Helly Hansen is looking for a Product Manager – Outdoor/Midlayer/Baselayer category
Oslo Founded in Norway in 1877, Helly Hansen continues to develop professional grade apparel that helps people stay and feel alive. Through insights drawn from living and working in the world’s harshest environments, the company has developed a long list of first-to-market innovations, including the first supple waterproof fabrics more ...

