

All Sporting Goods Intelligence articles in Online Content – Page 6
-
 Infographics & Data
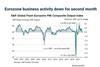
Eurozone business activity down for second month
The seasonally adjusted S&P Global Eurozone PMI® Composite Output Index dropped to 49.2 in August, from 49.9 in July signalling a second successive reduction in business activity across the eurozone following a 16-month period of growth.
-
 Infographics & Data
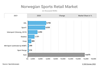
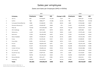
The Norwegian Sports Retail Market
This interactive chart shows the largest Norwegian sports retailers by revenue in thousand NOK (2020 and 2021) as well as the total market size 2020, 2021 including market shares. This chart can be downloaded as JPG, PNG or PDF.
-
 Infographics & Data
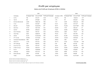
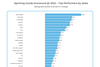
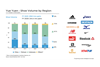
Top sporting goods companies by profit per employee
This exclusive interactive chart shows 19 major sporting goods brands as ranked by profit per employee for 2021, with comparative figures for 2020. The chart can be downloaded. This is exclusive data and analysis for Premium Members.
-
 Infographics & Data
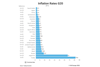
Inflation rates in the G20
This exclusive interactive chart shows inflation rates for June and July 2022 for all members of the G20. The chart can be downloaded. This is exclusive data and analysis for Premium Members.
-
 Infographics & Data
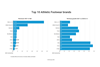
Top 10 Athletic Footwear Brands 2021
This exclusive interactive chart shows the top ten athletic footwear brands for 2021, by revenues and by year-on-year revenue growth. The chart can be downloaded. This is exclusive data and analysis for Premium Members.
-
 Infographics & Data
Top apparel brands on China’s Tmall during the latest lockdown
This exclusive interactive chart shows the top apparel brands from April 2021 to April 2022 on Alibaba’s e-tail site, Tmall. The chart can be downloaded. This is exclusive data and analysis for Premium Members.
-
 Infographics & Data
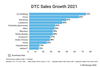
DTC Sales Growth 2021
This exclusive interactive chart shows the DTC sales growth of the major players in the sporting goods industry.
-
 Infographics & Data
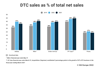
DTC sales of five major sports brands
This exclusive interactive chart shows the DTC sales of Adidas, Nike, Under Armour, VF Corp. and Puma as a percentage of total net sales for the financial years 2019, 2020 and 2021. The chart can be downloaded. This is exclusive data and analysis for Premium Members.
-
 Infographics & Data
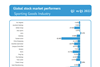
Global sports industry stock market - Q2 vs. Q1 2022
This exclusive interactive chart shows compares the stock performance of the top public companies in the sporting goods industry from Q1 to Q2 2022. The chart can be downloaded. This is exclusive data and analysis for Premium Members.
-
 Analysis
How COVID-19 has impacted the Fitness Market – Insights and Trends 2023
Thanks to vaccination and a bit more harmless variants of COVID-19, the fitness market is on the rise again. Booming for years before the pandemic caused a sudden halt, the branch is rearranging itself. In our fitness insights, we take a look at the situation before Corona hit, the changes ...
-
 Infographics & Data
Sales per employee in 2021
This exclusive chart and data can be downloaded by our Premium Members.
-
 Sponsored
Figure of the week
The European outdoor segment closed fiscal 2021 with the highest sales to date of €6.2 billion, an increase of 19 percent compared to the prior year.
-
 Infographics & Data
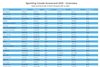
Sporting Goods Scorecard Q1 2022 - The top performers by sales and profit
This exclusive chart and data can be downloaded by our Premium Members.
-
 Sponsored
Your checklist for your OutDoor by ISPO visit
The anticipation is rising; finally, trade shows and personal meetings are possible again. To get you off to a good start at OutDoor by ISPO, we’ve compiled a checklist of the most important facts and links.
-
 Sponsored
Learn more about GORE-TEX products
Whether you want to become an expert yourself or train your colleagues – have a look at the training section on the GORE-TEX ONE Portal.
-
 Infographics & Data
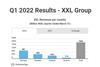
Q1 2022 Results XXL Group
This earnings briefing includes the highlights of the Q1 2022 for XXL Group
-
 Infographics & Data
Sporting Goods Scorecard 2021 - The top performers by sales and profit
With our exclusive Sporting Goods Scorecard, we give you an overview of top performers by sales and profit for FY 2021. Find out about the winners and losers in the industry. The Scorecard includes the revenue and profit development of all major global sporting goods brands. The chart can be downloaded. This is exclusive data and analysis for Premium Members.
-
 Analysis
Sporting Goods Industry Scorecard 2021
Exclusive: We give you an overview of top performers by sales and profit.
-
 Infographics & Data
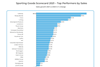
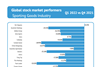
Global sports industry stock market performers - Q1 2022
This exclusive interactive chart shows compares the stock performance of the top public companies in the sporting goods industry from Q4 2021 to Q1 2022. The chart can be downloaded. This is exclusive data and analysis for Premium Members.
-
 Infographics & Data
Comparison of Yue Yuen’s shoe-producing regions by volume
This interactive chart compares Yue Yuen’s shoe-producing regions by volume. The chart can be downloaded. This is exclusive data and analysis for Premium Members.

