

All Sporting Goods Scorecard articles
-
 Analysis
The top sporting goods industry performers by sales and profits in Q2 2025
The 43 publicly traded companies in our quarterly scorecard have experienced a significant 45 percent decline in aggregated profits.
-
 Infographics & Data
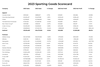
SGI Sporting Goods Scorecard 2024
For those looking for revenue and profit benchmarks of the leading brands and retailers in the sporting goods industry, we bring you our 2024 Sporting Goods Industry Scorecard (Split by Apparel, Footwear, Equipment, and Diversified/Retail)
-
 Analysis
The top sporting goods industry performers by sales and profits in Q1 2025
Key market players are still in turnaround mode as the sporting goods industry reports its first results of 2025.
-
 Analysis
Analysis: The top sporting goods industry performers by sales and profits in 2024
Annual profitability increased by 14.6 percent in 2024. Find out more in our latest scorecard.
-
 Analysis
Analysis: The top sporting goods industry performers by sales and profits in Q4 2024
Seven firms reported one-time charges of at least $10 million, offset by VF Corp., Wolverine Worldwide, Foot Locker, and Zumiez, who were overlapping large end-of-year write-downs. Excluding Topgolf, year-over-year Equipment RoS improved from a 3.8 percent year-on-year decline to essentially flat. Diversified/Retail is Q4’s strongest segment. Year-over-year RoS rose to ...
-
 Analysis
Analysis: The top sporting goods industry performers by sales and profits in Q3 2024
The aggregate year-over-year sales of 45 publicly traded sporting goods companies declined by less than 1 percent in the reporting period closest to Sept. 30 in Q3 2024. Find out more with our latest scorecard.
-
 Analysis
Analysis: The top sporting goods industry performers by sales and profit in Q2 2024
One-third of the companies – 15 in all – reported a net loss in the reporting period closest to June 30 in Q2 2024. Find out more with our latest scorecard.
-
 Analysis
Analysis: The top sporting goods industry performers by sales and profits in Q1 2024
Year-over-year RoS improved for Footwear and Diversified/Retail but declined in both Apparel and Equipment in Q1/24. Find out more in our latest scorecard.
-
 Infographics & Data
SGI Sporting Goods Scorecard 2023
For those looking for revenue and profit benchmarks of the leading brands and retailers in the sporting goods industry, we bring you our 2023 Sporting Goods Industry Scorecard (Split by Apparel, Footwear, Equipment, and Diversified/Retail)
-
 Analysis
Analysis: The top sporting goods industry performers by sales and profits in 2023
Annual profitability fell by 10.4 percent in 2023, with a decline in annual revenues of almost 3 percent. Find out more in our latest scorecard.
-
 Analysis
Analysis: The top sporting goods industry performers by sales and profits in Q4 2023
Quarterly losses were much reduced in Q4, but overall results were still negative. Find out more in our latest scorecard.
-
 Infographics & Data
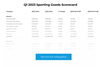
SGI Sporting Goods Scorecard Q3 2023
Find out whose sales are up and whose profits are down for Q3 2023 in our exclusive and downloadable version of our SGI Europe sporting goods industry scorecard. We’ve expanded our coverage and now examine 48 of the leading sporting goods industry companies.
-
 Analysis
Analysis: The top sporting goods industry performers by sales and profits in Q3 2023
Aggregate net income is down in every sector except one, with two big names shaping overall revenue. Find out more with our latest scorecard.
-
 Infographics & Data
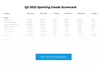
SGI Sporting Goods Scorecard Q2 2023
How did Apparel, Footwear, Equipment and Retail perform in the second quarter of 2023? Our Sporting Goods Industry Scorecard has the answer.
-
 Analysis
Analysis: The top sporting goods industry performers by sales and profits in Q2 2023
Facing difficult year-over-year comparisons in many cases, 2/3 of entrants reported lower sales from Q2 2022. Find out more with our scorecard.
-
 Infographics & Data
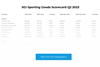
SGI Sporting Goods Scorecard Q1 2023
How did Apparel, Footwear, Equipment and Retail perform in the first quarter of 2023? Our Sporting Goods Industry Scorecard has the answer.
-
 Analysis
The top sporting goods industry performers by sales and profit Q1 2023
Our 2023 Q1 Scorecard includes the revenue and profit development of 48 sporting goods companies, as well as the headlines and analysis
-
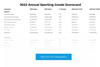 Infographics & Data
Sporting Goods Scorecard 2022
Our downloadable 2022 Sporting Goods Scorecard brings you the revenue & profit development of 47 global sporting goods companies in numbers
-
 Article
Sporting Goods 2022 – The top companies worldwide by sales and profit
Our updated 2022 Sporting Goods Scorecard brings you the industry winners, with revenue & profit development of 47 sporting goods companies.
-
 Analysis
Analysis: Sporting Goods Scorecard Q4 2022 – The top performers by sales and profit
Our Q4 Scorecard includes the revenue and profit development of 48 major sporting goods companies.

