
Latest Data, Analysis & Infographics – Page 5
-
 Infographics & Data
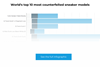
The most faked sneaker models
One brand dominates, but with which iconic line? Our infographic shows the RRP, counterfeit price and resale value of the 10 most counterfeited sneakers.
-
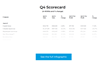
 Infographics & Data
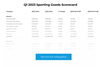
SGI Sporting Goods Scorecard Q1 2023
How did Apparel, Footwear, Equipment and Retail perform in the first quarter of 2023? Our Sporting Goods Industry Scorecard has the answer.
-
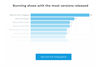
 Analysis
The top sporting goods industry performers by sales and profit Q1 2023
Our 2023 Q1 Scorecard includes the revenue and profit development of 48 sporting goods companies, as well as the headlines and analysis
-
 Infographics & Data
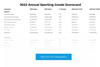
Sporting Goods Scorecard 2022
Our downloadable 2022 Sporting Goods Scorecard brings you the revenue & profit development of 47 global sporting goods companies in numbers
-
 Article
Sporting Goods 2022 – The top companies worldwide by sales and profit
Our updated 2022 Sporting Goods Scorecard brings you the industry winners, with revenue & profit development of 47 sporting goods companies.
-
 Article
The best consumer-rated outdoor and cycling brands
Our latest exclusive big data analysis reveals which brands top the consumer ratings for outdoor and cycling brands from over 145,000 reviews
-
 Infographics & Data
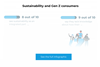
Sustainability and Gen Z Consumers
We bring you some key numbers from the latest research into Gen Z consumers and their thoughts on sustainability. See what 9 out of 10 think.
-
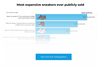 Infographics & Data
The most expensive sneakers ever publicly sold
The sneaker resale market is worth almost $30bn, set to increase to $100bn by 2026. We look at the most expensive sneakers ever sold.
-
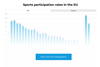 Infographics & Data
Sports participation rates in the EU by gender
Around 44 percent of the EU population do physical activity at least once a week. We take a closer look at the figures for each country.
-
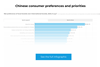 Infographics & Data
Chinese consumer preferences
McKinsey sees a Chinese market with “robust underlying demand.” But what leads to consumers’ preference for local over international brands?
-
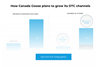 Infographics & Data
Canada Goose’s DTC growth plan
Canada Goose’s 5-year goals announced in February aim to increase DTC penetration. We look at a breakdown of the luxury brand’s own figures.
-
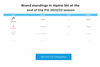 Infographics & Data
Brand standings at the end of the FIS 2022/23 season
To mark the end of the ski season, we’re sharing the brand standings of the FIS Alpine 2022/23 competition and discuss why brands sponsor winter sports.
-
 News briefs
Sports sunglasses market to register 7.53% CAGR by 2026
The global sports sunglasses market is projected to grow by US$1.40 billion between 2021 and 2026, representing a CAGR (compound annual growth rate) of 7.53 percent, according to a recent research report by Technavio. The market is driven by the growing popularity of sunglasses among the youth and middle-aged population. ...
-
 Analysis
Analysis: Sporting Goods Scorecard Q4 2022 – The top performers by sales and profit
Our Q4 Scorecard includes the revenue and profit development of 48 major sporting goods companies.
-
 Infographics & Data
Running shoes with the most versions released
Marathon season is on its way, and runners everywhere are lacing up their favorites. But which trainer models have stood the test of time?
-
 Infographics & Data
SGI Sporting Goods Scorecard Q4 2022
Find out whose sales are up and whose profits are down in Q4 2022 in our exclusive analysis of the sporting goods industry’s largest players.
-
 Analysis
Analysis: Taking stock of sporting goods inventory levels
Our exclusive analysis of the inventory levels of some of the industry’s biggest brands, including how some are responding to the challenges
-
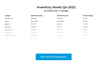 Infographics & Data
Sporting goods company inventory levels in Q4 2022
We’ve compiled inventory levels at the top sporting goods companies in Q4 2022. Found out how they compare with 2021 and across the industry
-
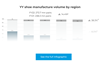 Infographics & Data
Yue Yuen’s 2022 shoe manufacture volume by region
We bring you a breakdown of Yue Yuen’s shoe manufacture volume by region
-
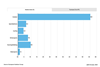 Infographics & Data
European 2022 retail sell-out sales across outdoor segments
We bring you a breakdown of retail sell-out sales across six outdoor segments in 2022 across six European countries

