
Latest Data, Analysis & Infographics – Page 9
-
 Article
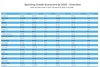
Analysis: Sporting Goods Industry Scorecard Q1 2022
Find out about the top industry performers. With our first quarter 2022 Sporting Goods Industry Scorecard, we provide an overview by sales and profit.
-
 Article
Difference in understanding of concussion causes and potential risk reduction in the U.S. and Germany
A survey conducted by consumer survey firm Nielsen and commissioned by Mips, the Swedish helmet safety technology company, has found that a wide gap exists between Americans’ and Germans’ knowledge of concussions and how to reduce the risk of concussions through helmet use. Nielsen surveyed a representative sample of 1,000 ...
-
 News briefs
Container xChange: Peak shipping season could be worse than last year
More than half (51 percent) of 200 forwarders, traders and shippers surveyed recently by Container xChange, a Hamburg, Germany-based technology infrastructure provider for container logistics companies, are predicting a “worse” third quarter shipping season than in 2021 when cargo surges resulted in record container shipping freight rates, delivery delays, port ...
-
 Infographics & Data
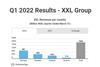
Q1 2022 Results XXL Group
This earnings briefing includes the highlights of the Q1 2022 for XXL Group
-
 Infographics & Data
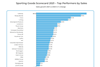
Sporting Goods Scorecard 2021 - The top performers by sales and profit
With our exclusive Sporting Goods Scorecard, we give you an overview of top performers by sales and profit for FY 2021. Find out about the winners and losers in the industry. The Scorecard includes the revenue and profit development of all major global sporting goods brands. The chart can be downloaded. This is exclusive data and analysis for Premium Members.
-
 Analysis
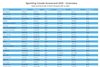
Sporting Goods Industry Scorecard 2021
Exclusive: We give you an overview of top performers by sales and profit.
-
 Infographics & Data
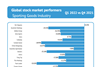
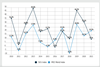
Global sports industry stock market performers - Q1 2022
This exclusive interactive chart shows compares the stock performance of the top public companies in the sporting goods industry from Q4 2021 to Q1 2022. The chart can be downloaded. This is exclusive data and analysis for Premium Members.
-
 Article
Analysis: Sporting Goods Industry stocks fell more than 16% in Q1 2022
According to SGI Europe’s quarterly study of selected public sporting goods industry stocks, their average share price fell by 16.25 percent on a sequential basis in the first quarter of 2022, in contrast with the performance of some major stock indexes during the same period. The Standard & Poor’s 500 ...
-
 Infographics & Data
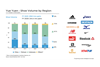
Comparison of Yue Yuen’s shoe-producing regions by volume
This interactive chart compares Yue Yuen’s shoe-producing regions by volume. The chart can be downloaded. This is exclusive data and analysis for Premium Members.
-
 Article
Two sports companies are among the most innovative 50 companies of 2022
The renowned business magazine Fast Company names the most innovative 50 companies every year. This year, Stripe came in first place. The payment service provider links the digital payment process with environmental protection measures. Stripe offers the possibility to participate in technology for CO2 reduction. Source: Fanatics Fanatics ...
-
 Infographics & Data
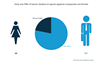
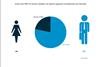
Gender breakdown of senior management at sports companies
This exclusive interactive chart shows the breakdown by gender of senior management at sports companies. The chart and data can be downloaded. This is exclusive data and analysis for Premium Members.
-
 Article
Women in sports business: facts and figures on international women’s day
#BreakTheBias is the slogan for International Women’s Day 2022, and many sports and outdoor brands are also using the slogan together with the hashtags #InternationalWomensDay and #IWD2022 for their own campaigns in the “Women’s Month of March.” On the occasion of Women’s Day, SGI Europe examined the quota of women ...
-
 Article
Industry stocks dropped by 0.5% in Q4
According to SGI Europe’s quarterly study of selected public industry stocks, their average share price declined by 0.51 percent on a sequential basis in the fourth quarter, in contrast with the performance of some major stock indexes during the same quarter. The Standard & Poor’s 500 index moved up by ...
-
 Analysis
Analysis: The industry’s market cap rose by 9.5% in 2021
This exclusive chart shows the development in the market capitalization of the top 88 stock-listed sporting goods companies between the end of 2020 and the end of 2021. This is exclusive data and analysis for Professional Members.
-
 Infographics & Data
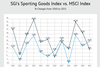
Infographic - SGI’s Sporting Goods Index vs MSCI Index - 2021 Update
This exclusive chart shows the development of the top 88 stock listed sporting goods companies in comparison with the MSCI Index over the past 11 years (2010 to 2021).
-
 Article
Analysis: The European Sports Retail Market
This is an exclusive, yearly statistic only available for subscribers of SGI Europe. It includes revenue and market share development of the major sporting goods retailers in 15 European countries.
-
 Infographics & Data
Top sporting goods retailers in Asia
This exclusive interactive chart ranks the top sporting goods retailers in Asia by revenues in USD for 2020 and percentage growth in their local currency. The charts and data can be downloaded. This is exclusive data and analysis for Premium Members.
-
 Infographics & Data
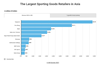
Top sporting goods retailers in Europe
This exclusive interactive chart ranks the top sporting goods retailers in Europe by revenues in USD for 2020 and percentage growth in their local currency. The charts and data can be downloaded. This is exclusive data and analysis for Premium Members.
-
 Infographics & Data
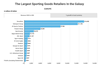
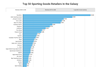
Top 50 Sporting Goods Retailers in the Galaxy
This exclusive interactive chart ranks the top 50 sporting goods retailers by revenues in USD for 2020 and percentage growth in their local currency. The charts and data can be downloaded. This is exclusive data and analysis for Premium Members.
-
 Infographics & Data
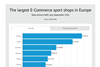
The largest e-commerce sports shops in Europe - Q3 2021 Update
This exclusive interactive chart shows the largest e-commerce sports shops in Europe ranked by the number of website visitors in Q3 2021, with % changes vs Q2 2021. Included are regular sporting goods retailers and pure e-tailers. The chart and data can be downloaded. This is exclusive data and analysis for Premium Members.

