

All Market Analysis articles
-
 Whitepapers
Whitepaper: Future-proof textiles 2025
A practical whitepaper by SGI Europe in cooperation with RUDOLF, explaining how upcoming rules and consumer expectations reshape material compliance and product development.
-
 Market Reports
Report: The German Performance Running Market 2025
How German runners choose, buy, and value their shoes. Drawing on 1,001 active runners and pricing analysis, the report covers consumer profiles, buying behaviour, channel preferences, brand choices, pricing strategy, and sustainability’s influence on purchasing decisions.
-
 Analysis
Analysis: 2024 Global Sporting Goods Industry Stocks Slip Lower in 2024
Which of the top 85 sporting goods companies performed best, and which lost ground in 2024? Get the figures.
-
 Article
Global sport market reaches $579 billion in 2023, equipment and footwear offset bicycle decline
The global sport market reached a value of $579 billion in 2023 with a growth rate of 1 percent vs 2022. This shows the latest Global Sport Market Estimate by Circana. The data presents a mixed picture across categories, with equipment and footwear growth compensating for a notable decline in ...
-
 Analysis
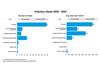
Analysis: 2023 Market Cap of global Sporting Goods stocks rising 2.4%
Which of the top 86 sporting goods companies performed best, and which lost ground in 2023? Get the figures.
-
 Infographics & Data
Becoming a super-winner in the sporting goods industry: The numbers from McKinsey
Some of the key numbers and strategies from McKinsey’s webinar “Becoming a super winner in the sporting goods industry,” available now only at SGI Europe.
-
 Infographics & Data
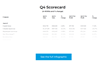
SGI Sporting Goods Scorecard Q4 2022
Find out whose sales are up and whose profits are down in Q4 2022 in our exclusive analysis of the sporting goods industry’s largest players.
-
 Infographics & Data
European 2022 retail sell-out sales across outdoor segments
We bring you a breakdown of retail sell-out sales across six outdoor segments in 2022 across six European countries
-
 Infographics & Data
Sporting goods deals 2016-2021
What was the average deal size and which category had the most deals 2016-2021? Find out in our latest interactive graphic.
-
 Infographics & Data
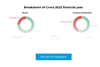
Crocs 2022 financial year revenue in detail
See how Crocs’ revenue for 2022 breaks down in our latest graphic.
-
 Infographics & Data
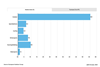
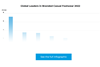
Global leaders in branded casual footwear 2022
Found out who were the leading casual footwear brands in 2022 in our latest graphic.
-
 Infographics & Data
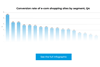
Conversion rate of e-com shopping sites by segment, Q4
See the conversion rates of various e-com segments in Q4, including four sporting apparel and footwear categories, in our graphic.
-
 Infographics & Data
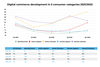
Digital commerce development in 5 consumer categories 2021/2022
See the changes in digital commerce revenue of the last 12 months in sporting goods, footwear, apparel and more in our graphic.
-
 Infographics & Data
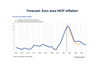
Forecasted HICP inflation in the Euro area
This chart shows the forecasted inflation rates for 2023 and 2024 in the Euro Zone from Eurosystem (the central banking system of the EU)
-
News briefs
NielsenIQ and GfK announce planned company merger
The two global data and analytics service providers NielsenIQ and GfK SE announced their planned merger. The step will create new opportunities for both companies in the area of retail and consumer analytics. Using advanced cloud technologies, NielsenIQ and GfK will be able to combine their complementary data and analytics ...
-
 Infographics & Data
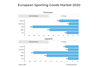
European Sports Sporting Goods Market 2020
The market for sports clothing and footwear fell by 8 percent to €28.3 billion in the five major European countries in 2020, according to revised estimates from NPD Group.

