
Latest Data, Analysis & Infographics – Page 2
-
 Analysis
Analysis: 2024 Global Sporting Goods Industry Stocks Slip Lower in 2024
Which of the top 85 sporting goods companies performed best, and which lost ground in 2024? Get the figures.
-
 Analysis
Analysis: The top sporting goods industry performers by sales and profits in Q3 2024
The aggregate year-over-year sales of 45 publicly traded sporting goods companies declined by less than 1 percent in the reporting period closest to Sept. 30 in Q3 2024. Find out more with our latest scorecard.
-
 Analysis
Vendor executive compensation fell 24% in 2023
Who in the sporting goods industry earned the best salary in 2023? Get the figures from our summary.
-
 Article
Global sport market reaches $579 billion in 2023, equipment and footwear offset bicycle decline
The global sport market reached a value of $579 billion in 2023 with a growth rate of 1 percent vs 2022. This shows the latest Global Sport Market Estimate by Circana. The data presents a mixed picture across categories, with equipment and footwear growth compensating for a notable decline in ...
-
 Analysis
Analysis: The latest inventory levels in the Sporting Goods Industry, Q2 2024
Our latest analysis examines industry inventory levels across 32 leading sporting goods companies for the period closest to June 30.
-
 Analysis
The world’s biggest sports retailers
Our annual analysis of the world’s largest sports retailers presents the revenue of the top international sports retailers and ranks their growth year-on-year.
-
 News briefs
Global yoga accessories market to post 7% CAGR by 2028
The success of health and fitness clubs and the health benefits of yoga are driving growth.
-
 Infographics & Data
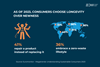
The rise of secondhand shopping and repair in 2023
Consumers in 2023 pivot to secondhand goods and repair services, championing sustainability while navigating economic pressures. This focused insight reveals a growing trend that’s reshaping consumer spending and driving the demand for longevity and environmental responsibility in all products.
-
 Infographics & Data
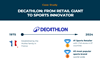
Decathlon’s status and evolution in 2024
Decathlon, the world’s largest sports retailer and the third most popular sports brand globally, has undergone a remarkable evolution. With a bold rebrand, strategic digital innovations, and key partnerships in global sports events, the company is redefining its place in the sports industry and shaping the future of retail.
-
 Analysis
Market Analysis: The sports equipment market 2023
Our annual summary compares the 2023 and 2022 global revenue and market-share development of 39 companies and provides a breakdown by sector.
-
 Analysis
Analysis: The top sporting goods industry performers by sales and profit in Q2 2024
One-third of the companies – 15 in all – reported a net loss in the reporting period closest to June 30 in Q2 2024. Find out more with our latest scorecard.
-
 Analysis
Market analysis: The sports apparel market of 2023
Our annual summary of the sports apparel market brings you global revenue and market-share development and a regional breakdown of 29 companies.
-
 Infographics & Data
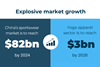
The growth trajectory of China’s athleisure market
China’s athleisure market forecast: Projected to reach $82.8 billion by 2024, highlighting key growth drivers and consumer trends.
-
 Analysis
Market Analysis: The global athletic footwear market
Our annual overview of the athletic footwear market shows the global sales of 25 companies and compares how 2023 has developed compared to 2022.
-
 Infographics & Data
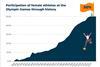
From zero to fifty: Achieving gender parity in Olympic Movement
Discover the journey towards gender equality in the Olympic Movement with our detailed infographic, showcasing key milestones and the remarkable increase in female athlete participation from 0% in 1896 to a projected 50% in 2024.
-
 Infographics & Data
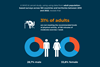
Physical inactivity among adolescents and adults
The latest data from the World Health Organization (WHO) highlights a significant global challenge: adolescents and adults are not meeting recommended physical activity levels.
-
 Analysis
Analysis: The top sporting goods industry performers by sales and profits in Q1 2024
Year-over-year RoS improved for Footwear and Diversified/Retail but declined in both Apparel and Equipment in Q1/24. Find out more in our latest scorecard.
-
 Infographics & Data
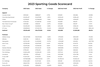
SGI Sporting Goods Scorecard 2023
For those looking for revenue and profit benchmarks of the leading brands and retailers in the sporting goods industry, we bring you our 2023 Sporting Goods Industry Scorecard (Split by Apparel, Footwear, Equipment, and Diversified/Retail)
-
 Analysis
Analysis: The top sporting goods industry performers by sales and profits in 2023
Annual profitability fell by 10.4 percent in 2023, with a decline in annual revenues of almost 3 percent. Find out more in our latest scorecard.
-
 Analysis
Analysis: The latest inventory levels in the Sporting Goods Industry, Q1 2024
Our latest analysis dives into inventory, covering levels at 29 leading sporting goods companies for the period that ended closest to March 31.

