
Latest Data, Analysis & Infographics – Page 6
-
 Infographics & Data
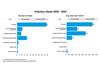
Gender and leadership in the sporting goods industry
How many women are on the executive teams and boards in the sporting goods industry? Find out in our latest exclusive interactive graphic.
-
 Infographics & Data
Sporting goods deals 2016-2021
What was the average deal size and which category had the most deals 2016-2021? Find out in our latest interactive graphic.
-
 Infographics & Data
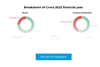
Crocs 2022 financial year revenue in detail
See how Crocs’ revenue for 2022 breaks down in our latest graphic.
-
 Infographics & Data
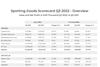
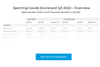
Analysis: Sporting Goods Scorecard - Q3 2022
Our Q3 Scorecard includes the revenue and profit development of 41 major sporting goods companies - benchmark yourself with the top players in the industry
-
 News briefs
Second-hand isn’t second best, says Unidays fashion report 2023
Unidays, a digital marketplace for student discounts and a networking platform, has conducted a new study among 3,279 of its (27 million worldwide) users in the U.S., U.K., and Australia. As Unidays is a student-only offering, the company connects with a purely Gen-Z target group. The Unidays Fashion Report 2023 ...
-
 Infographics & Data
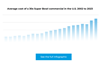
Average cost of a 30 second Super Bowl commercial in the U.S. 2002 to 2023
Found out how dramatically the cost of advertising at the Super Bowl has increased in our latest graphic.
-
 Infographics & Data
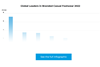
Global leaders in branded casual footwear 2022
Found out who were the leading casual footwear brands in 2022 in our latest graphic.
-
 Infographics & Data
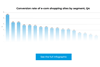
Conversion rate of e-com shopping sites by segment, Q4
See the conversion rates of various e-com segments in Q4, including four sporting apparel and footwear categories, in our graphic.
-
 Infographics & Data
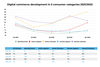
Digital commerce development in 5 consumer categories 2021/2022
See the changes in digital commerce revenue of the last 12 months in sporting goods, footwear, apparel and more in our graphic.
-
 Infographics & Data
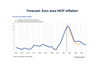
Forecasted HICP inflation in the Euro area
This chart shows the forecasted inflation rates for 2023 and 2024 in the Euro Zone from Eurosystem (the central banking system of the EU)
-
 Article
European Central Bank’s latest report shares new predictions on inflation 2023-2025
In December 2022, the European Central Bank (ECB) released its Eurosystem Staff Macroeconomic Projections for the Euro Area. With well-documented economic influences already leading to a sharp slowdown in real GDP growth in the third quarter of 2022, the main forecast was: The expectation of a short-lived and shallow recession ...
-
 Infographics & Data
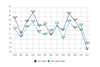
SGI’s Sporting Goods Index vs MSCI Index – 2022 Update
This exclusive chart shows the development of the top 87 stock-listed sporting goods companies compared to the MSCI Index over the past 12 years (2010 to 2022).
-
 Article
Analysis: Sporting Goods Industry stocks suffer double-digit market cap decline
This exclusive analysis shows the development in the market capitalization of the top 87 stock-listed sporting goods companies.
-
 Infographics & Data
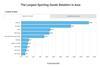
The largest sporting goods retailers in Asia
Our exclusive annual analysis of the largest sporting goods retailers in Asia. Charts and data are downloadable. Exclusive for Premium Members.
-
 Article
Analysis: Sporting Goods Scorecard Q3 2022 – The top performers by sales and profit
Our Q3 Scorecard includes the revenue and profit development of 42 major sporting goods companies.
-
 Analysis
Digital Payments and e-wallets: An overview about PayPal and co
PayPal appears to be far and away the West’s top provider of e-wallets. How did this come about, who are the competitors and what is the situation in other parts of the world?
-
 Infographics & Data
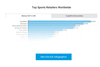
The Largest Sports Retailers Worldwide
Our exclusive annual analysis on the top 50 sports retailers worldwide. The charts and data can be downloaded. This is exclusive data and analysis for Premium Members.
-
 Analysis
The world’s biggest sports retailers 2021
This exclusive, yearly statistic shows the revenue development of the 50 largest sports retailers worldwide.
-
 Article
World Athletics publishes study of online abuse
World Athletics, the worldwide governing body for track and field, has published a second Online Abuse Study. The first was conducted during the Tokyo Olympics (in 2020), focused on Twitter, and inspired World Athletics to adopt what it calls a safeguarding policy in November 2021. The body revised the policy ...
-
 News briefs
CIP’s ISPO presentation optimistic on pádel
Pádel, it appears, continues to thrive. At the freshly concluded ISPO Munich 2022 the Clúster Internacional del Pádel (CIP) reported that pádel-racquet sales increased by nearly 72 percent year-on-year in the second quarter, according to Diffusion Sport. This was, however, down from the more than 85 percent rise of the ...

