Puma confirmed its guidance for the full year and hinted at a possible upgrade after sales in the second quarter rose by a reported 5.9 percent compared to the year earlier, or 11.1 percent in local currencies, to reach €2,121 million. It also indicated it would be able to adjust its full-year outlook upwards should its business continue to develop favorably in the third quarter. For now, it is confirming expectations of currency-adjusted sales growth in the high single-digit percentage range, an Ebit of €590 million to €670 million against €641 million in 2022, and a corresponding change in net profit.
| Puma - Income | |||
|---|---|---|---|
| 2023 | 2022 | Change | |
| H1 (€ million) | |||
| Sales | 4,308.3 | 3,914.1 | 10.1% |
| Cost of sales | 2,341.6 | 2,081.1 | 12.5% |
| Gross profit | 1,966.8 | 1,833.0 | 7.3% |
| Royalty and commission income | 15.9 | 13.4 | 18.7% |
| Other operating income and expenses | -1,691.7 | -1,504.1 | -12.5% |
| Operating result (EBIT) | 290.9 | 342.4 | -15.0% |
| Financial result | -30.8 | -25.9 | -18.9% |
| Earnings before taxes (EBT) | 260.1 | 316.4 | -17.8% |
| Tax | 65.0 | 80.7 | -19.5% |
| Net income | 172.3 | 205.6 | -16.2% |
| Diluted EPS | 1.15 | 1.37 | -16.1% |
| Q2 (€ million) | |||
| Sales | 2,120.7 | 2,002.0 | 5.9% |
| Cost of sales | 1,170.9 | 1,071.1 | 9.3% |
| Gross profit | 949.8 | 930.9 | 2.0% |
| Royalty and commission income | 8.9 | 6.7 | 32.8% |
| Other operating income and expenses | -843.4 | -791.2 | -6.6% |
| Operating result (EBIT) | 115.3 | 146.3 | -21.2% |
| Financial result | -23.0 | -12.9 | -78.3% |
| Earnings before taxes (EBT) | 92.4 | 133.4 | -30.7% |
| Tax | 23.0 | 34.0 | -32.4% |
| Net income | 55.0 | 84.3 | -34.8% |
| Diluted EPS | 0.37 | 0.56 | -33.9% |
| Source: Puma | |||
The German sportswear company is holding its course, although it stressed that “the macroeconomic environment and volatile retail demand remain challenging, particularly in North America and Europe, as recession risks weigh on consumer sentiment.” It added that the pattern of China’s post-Covid economic recovery continues to be “uncertain.”
In the second quarter, growth was led by the EMEA and Asia Pacific regions, which respectively booked 25.0 percent and 24.4 percent currency-adjusted top-line growth. Growth in Asia Pacific was underpinned by a continued recovery in Greater China. Sales in the Americas instead declined by a currency-adjusted 4.4 percent, with Latin America continuing to perform strongly but North America negatively affected by macroeconomic headwinds and the company’s “relative dependency” on the off-price wholesale business. Puma pledged that this dependence would be “strategically contained” going forward.
| Puma - Sales by region | |||
|---|---|---|---|
| 2023 | 2022 | Change | |
| H1 (€ million) | |||
| EMEA | 1,729.7 | 1,415.1 | 22.2% |
| Americas | 1,689.4 | 1,756.5 | -3.8% |
| Asia-Pacific | 889.2 | 742.6 | 19.7% |
| Total | 4,308.3 | 3,914.1 | 10.1% |
| Q2 (€ million) | |||
| EMEA | 846.0 | 706.2 | 19.8% |
| Americas | 861.5 | 940.6 | -8.4% |
| Asia-Pacific | 413.3 | 355.1 | 16.4% |
| Total | 2,120.7 | 2,002.0 | 5.9% |
| Source: Puma | |||
The quarterly gross margin narrowed by 1.70 percentage points to 44.8 percent as currency headwinds gathered strength while sourcing and freight costs continued to weigh, as did continued promotional activity. These factors were partially offset by price adjustments and a positive geographical and distribution channel mix.
Operating expenses rose by 6.6 percent to €843.4 million, driven by growth in Puma’s direct-to-consumer (DTC) channel. On a currency-adjusted basis, DTC sales jumped by 26.5 percent and grew to represent 24.3 percent of all sales, up from 21.9 percent in the second quarter of 2022 amid continued brand momentum and improved product availability. Within its DTC business, Puma’s sales in owned & operated retail sales increased by a currency-adjusted 30.4 percent, while e-commerce sales were up by 19.1 percent.
Mainly due to the shrinking gross margin, second quarter Ebit fell by 21.2 percent to €115.3 million. Net profit slipped by 34.7 percent to €55.0 million.
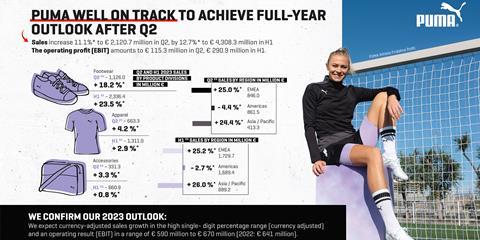
By product category, sales of footwear were up by a currency-adjusted 18.2 percent, amid strong demand for its football, basketball and performance running categories as well as sportstyle. Apparel sales increased by a currency-adjusted 4.2 percent, while accessories posted 3.3 percent growth. In the first half of 2023, footwear represented 54 percent of all sales, followed by 31 percent for apparel and 15 percent for accessories.
| Puma - Sales by division | |||
|---|---|---|---|
| 2023 | 2022 | Change | |
| H1 (€ million) | |||
| Footwear | 2,336.4 | 1,948.6 | 19.9% |
| Apparel | 1,311.0 | 1,304.4 | 0.5% |
| Accessories | 660.9 | 661.1 | 0.0% |
| Total | 4,308.3 | 3,914.1 | 10.1% |
| Q2 (€ million) | |||
| Footwear | 1,126.0 | 1,007.3 | 11.8% |
| Apparel | 663.3 | 665.7 | -0.4% |
| Accessories | 331.3 | 329.0 | 0.7% |
| Total | 2,120.7 | 2,002.0 | 5.9% |
| Source: Puma | |||
As of June 30, 2023, inventory was up 8.1 percent compared to the year-earlier at €2,146, returning to what Puma said was a normalized level.
Puma noted that its supervisory board has extended the contract of Hubert Hinterseher, its CFO, until the end of 2027. Hinterseher has served as CFO of the company since June 2021.
“If our business continues to develop favorably in the third quarter of 2023, Puma will be able to adjust its outlook for 2023,” the company said. “As in previous years, Puma will continue to focus on overcoming short-term challenges without compromising the brand’s mid- and long-term momentum, prioritizing sales growth and market share gains over short-term profitability.”