
Latest Data, Analysis & Infographics – Page 8
-
 Infographics & Data
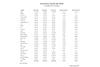
Sporting goods company inventory levels in Q2 2022
This exclusive interactive chart shows inventory levels at 28 sporting goods companies for Q2 2022, comparing with Q2 2021 and Q4 2021. The chart can be downloaded. This is exclusive data and analysis for Premium Members.
-
 Article
Why sporting goods industry inventories rose by 57% in Q2 2022
The aggregate inventory level for 28 public sporting goods companies, tracked by SGI Europe, rose more than 57 percent year-over-year to more than €31.9 billion at Q2 end and was up by nearly 32 percent from the end of 2021 when it stood at €24.27 billion. Eleven companies had inventory ...
-
 News briefs
Number of affiliated sports participants in France heavily impacted by the pandemic
According to the latest figures by France’s National Institute of Youth and Popular Education (INJEP), published in Filière Sport by Union Sport et Cycle, the number of affiliated sports participants in 2021 amounted to 14.4 million, representing a 14.9 percent decrease from the previous year. Multisport federations were the most ...
-
 Infographics & Data
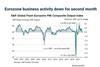
Eurozone business activity down for second month
The seasonally adjusted S&P Global Eurozone PMI® Composite Output Index dropped to 49.2 in August, from 49.9 in July signalling a second successive reduction in business activity across the eurozone following a 16-month period of growth.
-
 Infographics & Data
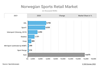
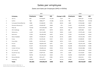
The Norwegian Sports Retail Market
This interactive chart shows the largest Norwegian sports retailers by revenue in thousand NOK (2020 and 2021) as well as the total market size 2020, 2021 including market shares. This chart can be downloaded as JPG, PNG or PDF.
-
 Infographics & Data
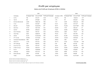
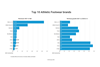
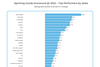
Top sporting goods companies by profit per employee
This exclusive interactive chart shows 19 major sporting goods brands as ranked by profit per employee for 2021, with comparative figures for 2020. The chart can be downloaded. This is exclusive data and analysis for Premium Members.
-
 Infographics & Data
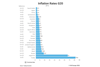
Inflation rates in the G20
This exclusive interactive chart shows inflation rates for June and July 2022 for all members of the G20. The chart can be downloaded. This is exclusive data and analysis for Premium Members.
-
 Article
Market Analysis: The athletic footwear market
This is an exclusive, yearly statistic only available for subscribers of SGI Europe. It includes revenue and market share development of the major global athletic footwear brands including breakdown by region.
-
 Infographics & Data
Top 10 Athletic Footwear Brands 2021
This exclusive interactive chart shows the top ten athletic footwear brands for 2021, by revenues and by year-on-year revenue growth. The chart can be downloaded. This is exclusive data and analysis for Premium Members.
-
 Infographics & Data
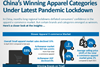
Top apparel brands on China’s Tmall during the latest lockdown
This exclusive interactive chart shows the top apparel brands from April 2021 to April 2022 on Alibaba’s e-tail site, Tmall. The chart can be downloaded. This is exclusive data and analysis for Premium Members.
-
 News briefs
Winners and losers in the Chinese e-commerce market
Lockdowns lasting months in some areas have unsettled consumers in China. The apparel market has not escaped this. The NPD Group provides an overview of the biggest winners and losers – sports brands among them – on the most important e-commerce platform in China, Tmall. Source: Screenshot from ...
-
 Infographics & Data
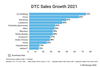
DTC Sales Growth 2021
This exclusive interactive chart shows the DTC sales growth of the major players in the sporting goods industry.
-
 Infographics & Data
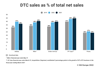
DTC sales of five major sports brands
This exclusive interactive chart shows the DTC sales of Adidas, Nike, Under Armour, VF Corp. and Puma as a percentage of total net sales for the financial years 2019, 2020 and 2021. The chart can be downloaded. This is exclusive data and analysis for Premium Members.
-
 Infographics & Data
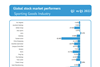
Global sports industry stock market - Q2 vs. Q1 2022
This exclusive interactive chart shows compares the stock performance of the top public companies in the sporting goods industry from Q1 to Q2 2022. The chart can be downloaded. This is exclusive data and analysis for Premium Members.
-
 Article
Analysis: Sporting goods industry stocks down more than 14% in Q2 2022
According to SGI Europe’s quarterly study of 38 select sporting goods industry stocks, the decline was less than the 16.25 percent average decline in the first quarter of 2022, when 34 out of 36 stocks posted a stock price drop from the end of the fourth quarter. Five of the ...
-
 Analysis
How COVID-19 has impacted the Fitness Market – Insights and Trends 2023
Thanks to vaccination and a bit more harmless variants of COVID-19, the fitness market is on the rise again. Booming for years before the pandemic caused a sudden halt, the branch is rearranging itself. In our fitness insights, we take a look at the situation before Corona hit, the changes ...
-
News briefs
YouGov survey examines sports fans’ attitudes in 51 countries
A new, free whitepaper released by market researching company YouGov titled “uncovering the socially responsible sports fan” has been conducted in 51 countries around the world to learn more about the social and environmental attitudes of sports aficionados. In the report, YouGov Sport aims to help understand the impact of ...
-
 Infographics & Data
Sales per employee in 2021
This exclusive chart and data can be downloaded by our Premium Members.
-
 Article
Analysis: Sales per employee increased 18% in 2021
Aggregate, year-over-year employee growth at 19 sporting goods companies rose 9.7 percent in 2021 as average sales per employee (SPE) at these firms increased 18.4 percent to €390,000. These calculations were made after SGI Europe scoured annual reports for year-end employee counts, which often were detailed to include full-time employees, ...
-
 Infographics & Data
Sporting Goods Scorecard Q1 2022 - The top performers by sales and profit
This exclusive chart and data can be downloaded by our Premium Members.

